statgraphicslogo

UNCOMPROMISING QUALITY, INSIGHT AND EXCELLENCE THROUGH BUSINESS INTELLIGENCE AND DATA ANALYTICS.

That’s the Statgraphics value proposition. It speaks to the current business environment that demands reliance on the data sciences to progress. Our intuitive interface is unparalleled in power and sophistication, matched with simplicity of use. With Statgraphics 19®, you will effortlessly develop protocols necessary to achieve successful outcomes. It gives you the statistical tools to pursue excellence, gain understanding and accomplish important business goals. The objective: advancement of systems performance for quality, increased productivity, development of best practices, and optimization of policies and procedures, driving cost saving efficiencies and controls. Achieve success through quality, insight and excellence in every segment of your enterprise.

New in release 19.3: Trellis plots!

New in release 19.6: Accelerated Life Testing!

Statgraphics Centurion Version 20 beta test now underway! Featuring 10 new machine learning procedures and a new Supervised AI Machine Learning Wizard.

Elevate operations, advance to the apex and reach the summit by partnering with Statgraphics data science analytics. Find solutions to your most complex challenges. Eliminate conjecture, proceed with confidence and uncover the route to achievement and success in every aspect of your corporate mission.

STATGRAPHICS Centurion XIX contains over 290 features, including a new link to Python functionality, modernized graphical user interface with a convenient feature-locating ribbon bar, a procedure dashboard, big data capability and so much more.

You owe it to your business to take a look. You owe it to yourself to make your work exceed expectations and outpace the competition, while making your job easier. Download a Free 30-Day Trial Copy now! We promise, you will be amazed.

Install a Free 30-day Trial Today.

DOWNLOAD PROGRAM
WATCH A VIDEO
CONTACT US

Trusted By Thousands of Leaders in Business, Industry and The Sciences

logo-nasa logo-saralee logo-abbott logo-alcoa logo-porsche pandg logo-exxon

Statgraphics

The Statistical Program That Started it All...

Statgraphics was the first statistical software program adapted for the PC, the  first to introduce integration of graphics into every statistical procedure, and the originator of point-by-point assistance tools and countless other groundbreaking features to simplify your tasks. While others were busy playing catch up, Statgraphics led the pack in providing pioneering advances. Want an assistant to guide you through each phase of your analysis and skip the learning curve? StatWizard ™ and StatAdvisor™ are at your service.
And our trailblazing continues… See what Statgraphics users have to say about the software in their own words.

Version 19 contains

15 new statistical procedures

including stability studies, decision forests and other machine learning algorithms, a new graphical user interface, integration with both R and Python, improvements to the DOE Wizard, and significant enhancements to 40 existing procedures.

The enhancements emphasize the increasing importance of data visualization and predictive analytics, both for unlocking the information that is often hidden in collected data and for understanding the meaning of statistical methods applied to that data.

Existing customer? Interested in upgrading?

NEW FEATURES HERE!

SIGN UP FOR SPECIAL OFFERS


Feature Highlight

Statgraphics products are created for professionals in every industry to optimize their business processes, improve their products and services and outpace their competitors. Success comes standard...

Data visualization

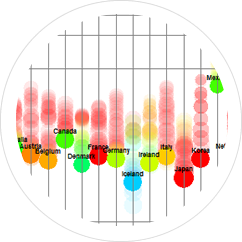
Data visualization. See the big picture and gain new insights when visualizing your data. Version 19 contains 28 interactive Statlets to aid in visualizing data. By manipulating the controls on the toolbar, changes may be viewed dynamically. With Statgraphics superior graphical capability there is nothing left unseen!

File:R logo.svg

R Interface. Statgraphics is now integrated with R, enabling users to greatly expand the capabilities of Statgraphics Centurion 19. With this interface, you can enjoy seamless integration between R programmers and Statgraphics users. Data scientists working in R can now share their work with others throughout the organization, speeding the flow of actionable information.

Python Interface

Python Interface. Statgraphics 19 adds a new interface to Python, a high-level programming language that is very popular amongst scientists, business analysts, and anyone who wants to develop specialized methods for analyzing data. The interface makes it easy to pass data back and forth and to execute Python scripts from within Statgraphics.

StatAdvisor

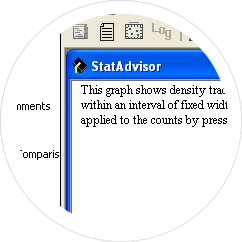
StatAdvisor™. The StatAdvisor makes statistical output understandable by individuals who may not be professional statisticians. It explains the critical insights to be gained from each output table, explaining the significance (or lack thereof) of the results. StatAdvisor output is perfect for pasting into a report to disseminate to others.

Quality management and improvement

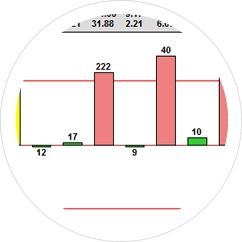
Quality Management and Improvement. Quality improvement made simple. Need SPC? Effortlessly kick your quality projects up a notch. Control multiple process variables simultaneously with the new dashboard that generates alerts when unusual events occur. See our wide selection of tools for quality assessment, capability analysis, control charts, gage studies, acceptance sampling, Monte Carlo simulation, and Lean Six Sigma.

Design of experiments wizard

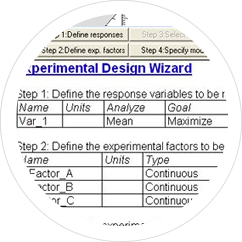
Design of Experiments Wizard. Breeze through projects. Reduce costs. The DOE Wizard steps you through each stage of the experimental design process. Version 19 adds alias optimal designs to its extensive catalog of screening, response surface, mixture and RPD experiments. It also adds the ability to augment existing experiments by adding runs in such a way that design efficiency is optimized.

Download a Free 30-Day Test Copy! 
ico-six-sigma

Are you a Six Sigma Professional?

Discover what the Six Sigma Toolbox can do for your process improvement

See more

Services

ill-training

Training. Statgraphics Technologies, Inc. and its worldwide dealers conduct both public and on-site seminars covering the use of Statgraphics Centurion for statistical analysis. The seminars are appropriate for both new and advanced users.

ill-support

SupportStatgraphics and its dealers are dedicated to providing first-class technical support. Statgraphics.com contains a large number of instructional videos, how-to guides and recorded webinars. Our support specialists are also available by e-mail or phone and are highly knowledgeable about both Statgraphics and statistical methods.

ill-validation

Validation. Before release of each new version, extensive tests are performed to ensure that the program operates properly. For users needing to validate the statistical results for regulatory agencies, we will be happy to cooperate in providing information about our software and development procedures.

Visit our Blog!

and get insights on Statgraphics products and ideas!