Statgraphics Centurion XVI
STATGRAPHICS Centurion XVI Contents
 STATGRAPHICS Centurion XVI is designed for anyone who wishes to do serious data analysis without investing weeks learning how to use a statistical package. It contains over 180 statistical procedures, covering everything from summary statistics to graphical representation of data. Yet you don't need to be a statistician to use the program. Everything is completely menu-driven, and there are tools such as the StatWizard and StatAdvisor to help you use the program most effectively.
STATGRAPHICS Centurion XVI is the 16th version of STATGRAPHICS for PC's. The first version was released in 1982. Our clients include many of the largest companies around the world looking to do graphical representation of data.
The statistical procedures in STATGRAPHICS Centurion XVI are divided into several major sections:
- Plot - Basic graphical representation of data plots, including scatterplots, matrix plots, exploratory plots, multivariate visualization techniques, time sequence plots, business charts, probability distribution plots, splines, 3D surface plots and contour plots.
- Describe - Descriptive statistics, including confidence intervals, hypothesis tests, tolerance limits, outlier identification, tests for normality, distribution fitting for censored and uncensored data, Weibull analysis and other life data analysis methods, tabulation and crosstabulation, multivariate methods such as PCA, factor analysis, cluster analysis, and correspondence analysis, nonparametric methods, time series smoothing and seasonal decomposition, and point process modeling for repairable systems.
- Compare - Comparison of more than one sample. Includes two sample comparisons for independent and paired samples, multiple sample comparison, ANOVA, variance components estimation, and a general linear models procedure.
- Relate - Regression and classification methods, including simple regression, polynomial regression, nonlinear regression, multiple and stepwise regression, calibration models, comparison of intercepts and slopes, ridge regression, PLS, logistic regression, probit analysis, Poisson and negative binomial regression, life data regression (parametic and nonparametric), discriminant analysis and a neural network Bayesian classifier.
- Forecast - Time series analysis and forecasting, including an automatic model selection procedure. Models include exponential smoothing, moving averages, random walks, linear and nonlinear trends, and ARIMA models.
- SPC - Methods for statistical process control, including Pareto charts, cause-and-effect diagrams, QFD, process mapping, capability analysis for variables and attributes, 27 types of control charts (including charts for multivariate data), gage R&R and linearity studies, and acceptance sampling.
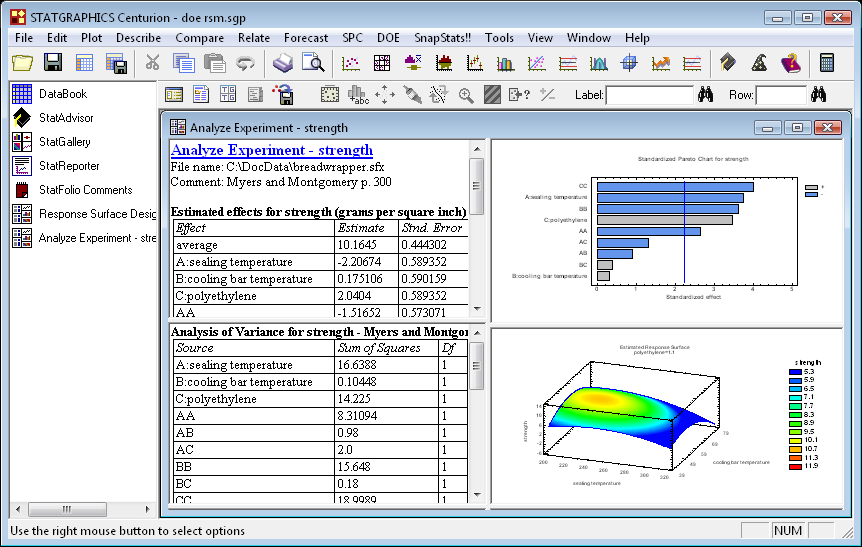
- DOE - Design of experiments, including factorial and fractional factorial designs, Box-Behnken designs, central composite designs, Plackett-Burman designs, Draper-Lin designs, D-optimal designs, simple-lattice and simple-centroid designs for mixture experiments, robust parameter designs (Taguchi and Montgomery), BIB, randomized block, and Latin square designs for categorical factors. Analysis includes multi-response optimization and an interactive graphical response surface explorer.
- SnapStats - Streamlined versions of heavily used procedures such as Process Capability Analysis that produce a single preformatted page with six tables and graphs.
- Tools - Statistical tools including sample size determination, a Six Sigma calculator, sampling distributions, and Monte Carlo simulation.
Editions
32-bit and 64-bit editions English, French, German, Italian, Spanish, Bilingual, Multilingual
More Information
List of statistics calculated and tests performed
User Manual in PDF format
Product brochure
Enhancements added to Version XVI
STATGRAPHICS Centurion Features
Some of the features that set STATGRAPHICS apart from its competition are:
- StatWizard – The StatWizard helps you select the proper analyses for your data. You can search for desired statistics or let the wizard select analyses based on the type of data you supply.
- StatAdvisor™ – The StatAdvisor explains the significance of your statistical results. It creates a short paragraph or two in simple language, capturing the actual results of your analyses and indicating whether or not the tests are statistically significant.
- StatLink™ – StatLink links your analyses to one or more data sources so that the analyses update whenever the data change. This makes it easy to create analyses that update dynamically. It also makes it simple to import data from programs such as Microsoft Access or Excel.
- Six Sigma Toolbox – STATGRAPHICS contains a complete set of tools for implementing Six Sigma programs. There's even a special menu organized around the Six Sigma DMAIC paradigm.
- Design of Experiments Wizard – The Experimental Design section of STATGRAPHICS contains a new wizard that a guides users through a 12-step process to construct and analyze a designed experiment.
- StatGallery™ – The StatGallery places graphs side-by-side or overlays them to help compare multiple data sets. It lets you create displays that the designers never thought of.
- StatReporter™ – The StatReporter organizes results for easy publication. You can copy all of your results into the reporter and save it in RTF format for import into Microsoft Word.
- StatPublish™ – This feature lets you save output for viewing in web browsers. It automatically creates HTML pages with imbedded images.
- StatFolios™ – A StatFolio saves all of your analyses in one file so that they can be repeated whenever necessary. If the input data change, so will the results.


