
-1.jpg?width=155&name=iStock-482381446%20(1)-1.jpg) Pre-release copy of Version 18 available for download!
Pre-release copy of Version 18 available for download!
Statgraphics Centurion XVII is a major upgrade to Statpoint's flagship data analysis and visualization product. It contains 32 new statistical procedures and significant upgrades to 20 other existing procedures. The images below show some of the most significant enhancements over Statgraphics Centurion XVI. For a description of all Version 17 enhancements, download Statgraphics Centurion Version 17 Enhancements.pdf.

| New Features and Enhancements | |
|---|---|
Interface to RThe Statgraphics to R interface lets users run Statgraphics and R side-by-side, sharing the same data; transfer your data between Statgraphics and R; you can even text mine by extracting information from various sources such as survey responses, emails and social media. |
 |
Correlation PlotThe Correlation Plot (also called a corrgram) displays the estimated correlations or partial correlations for a set of quantitative variables in the form of a matrix with colored cells. If desired, only cells with statistically significant correlations will be displayed. |
|
Laney P' and U' Control ChartsNew control charts have been added to monitor overdispersed rates and proportions. Tests have been added to the existing P and U charts to determine when these charts should be used. |
|
Deviation DashboardThis new Statlet indicates the status of multiple variables by displaying how much they deviate from their respective means. The primary format shows each variable using a vertical bar, the color of which indicates how many standard deviations the variable is from its mean. The controls on the Statlet toolbar interactively change the time period for which the data is displayed. |
 |
Demographic MapsThe Map by State procedure has been renamed Demographic Map and moved to the Plot menu. It can now create maps for any regions defined by a BNA boundary file. A new gradient fill may be used to indicate the level of a selected quantitative variable. |
 |
KrigingA new procedure has been added for estimating the value of a random variable based on measurements made at locations distributed throughout a 2-dimensional region. Called Kriging, the procedure first creates a variogram to estimate the spatial dependence between measurements. Estimates are then made at unmeasured locations throughout the region. |
 |
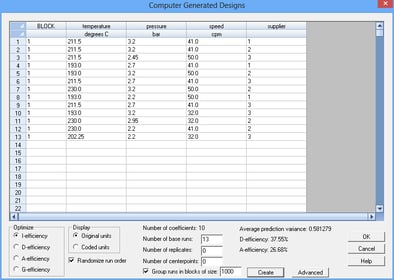
Computer Generated DesignsComputer Generated designs, created by the DOE Wizard, are experimental designs which have optimal properties with respect to the estimation of specific statistical models. Given the definition of an experimental region (including linear factor constraints), a model to be estimated, and the number of experimental runs that can be performed, the program searches for a set of runs that maximize a selected design criteria (A, D, G or I optimality). |
 |
Bivariate Density EstimationA new Statlet has been added to display the joint distribution of 2 random variables. The estimated density function may be displayed using a bivariate frequency histogram, a bivariate normal distribution, or a nonparametric density estimate. |
 |
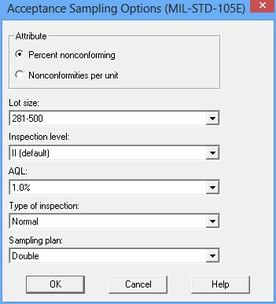
MIL-STD-105E, 414, and 1916 Acceptance Sampling Plans for Attributes and VariablesNew procedures calculate the required sample sizes for implementing standard acceptance sampling plans. The plans include "zero acceptance number" sampling plans in which a lot of N items is accepted if a sample of n items has no nonconforming members. Single, double and multiple sampling plans are included. |
 |
Dynamic Visualizers for Multiple Time SeriesThree new Statlets have been developed to help users visualize the changes in multiple variables over time. Given n time series observed over p time periods, the program generates a dynamic display that illustrates how each of the variables has changed over time. The controls on the Statlet toolbar let the user change the period for which the data are displayed. |
 |
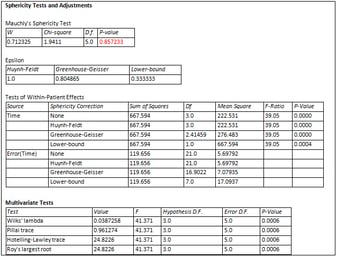
Repeated Measures ANOVANew procedures have been added to facilitate the analysis of oneway and twoway repeated measures designs.Included in the procedures is Mauchley’s test for sphericity, which is a condition requiring that the variance between any two estimated treatment means be the same. Corrections to the standard F-test are included for cases when sphericity is not present. Alternative MANOVA tests are also included. |
 |
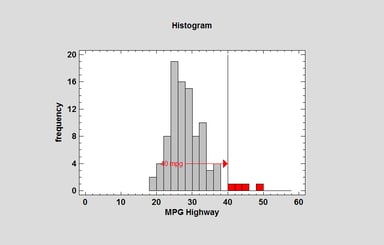
Graphics - Object EditingNew features available in all graphs include: addition of objects such as arrows, lines and rectangles; highlighting selected objects such as selected bars in a histogram; interactive manipulation of text font sizes; improved recording of videos; enhanced zoom and pan; highlighting of points by a secondary variable. |
 |
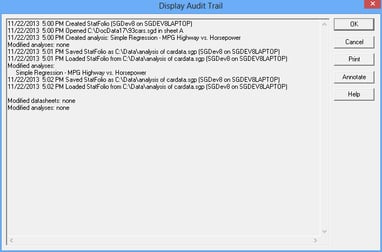
Audit Trails and Electronic SignaturesBeginning with Version 16.2, Statgraphics Centurion saved as part of a StatFolio an audit trail that tracks important events in the life of a StatFolio (the main Statgraphics document). Version 17 adds an electronic signature to the audit trail, created from the username and computer name of the active Windows session. |
 |
Multivariate VisualizerThis new Statlet is designed to plot multiple time series in a manner that helps users visualize the changes in multiple variables over time. Given nsamples for each of m variables observed over p time periods, the program generates a dynamic display that illustrates how each of the variables has changed over time.Several different types of plots may be created, including barcharts, piecharts, profile plots, strip plots, starplots, and Chernoff faces. As time evolves, the analyst can follow changes in all of the variables and all of the samples simultaneously. |
 |
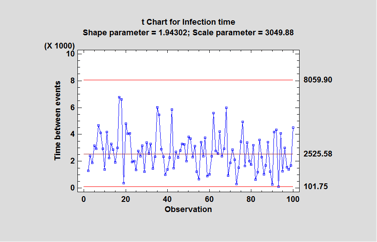
G and T Control ChartsThese new procedures create control charts for the length of time between the occurrence of rare events. They are based on the geometric and Weibull distributions, respectively. These type of charts are used frequently in the health sciences to monitor the occurrence of events such as post-surgical infections. Input data may consist of either the times at which events occurred or the length of time between events. |
 |
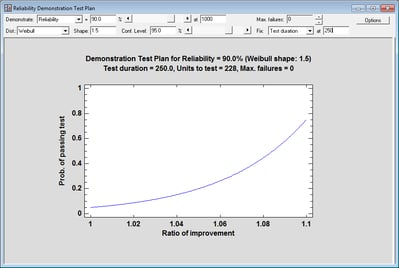
Reliability Demonstration Test PlansThis new Statlet creates test plans to demonstrate that a failure time distribution satisfies stated conditions. For example, it may be desired to show with 95% confidence that the reliability of a product equals or exceeds 90% at the end of the warranty period. During the demonstration, n units will be tested for a duration equal to t. The demonstration will be considered successful if no more than f units fail during the test. The user specifies either the number of units to be tested or the duration of the test. The procedure solves for the other quantity. |
 |
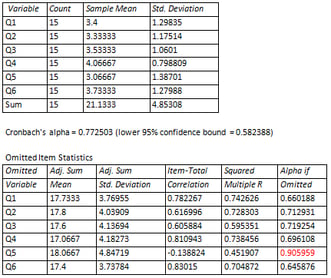
Item Reliability AnalysisThis new procedure is designed to estimate the reliability or consistency of a set of variables. It is commonly used to assess how well a set of questions in a survey, each of which is designed to illicit information about the same characteristic, give consistent results. The major output of the procedure is Cronbach’s alpha. Alpha may be calculated directly from the input variables, or the variables may first be standardized so that they have equal variances. The effect on alpha when each variable is separately omitted is also estimated, so that unreliable questions can be identified. |
 |
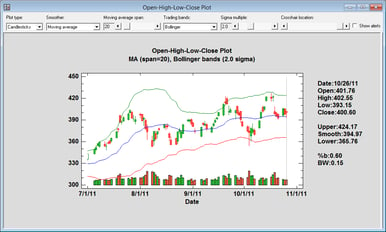
Open-High-Low-Close Candlestick PlotThis new Statlet is designed to plot security prices in a manner often used by stock traders. It shows the opening price for each trading session, high and low prices during the session, and the closing price using a graphical image often referred to as a candlestick. Trading bands may be plotted around the smoothed line at either a fixed percentage or using the method developed by Bollinger.Trading volumes may also be displayed as bars along the bottom of the plot. |
 |
Value LabelsValue labels may now be associated with numeric columns. Value labels are character strings that replace specific values in the column when output for that column is displayed. For example, stock analysts sometimes classify individual securities as "Strong Buy", "Buy", "Hold", "Sell", or "Strong Sell". Rather than entering those strings in a character column, it is often easier to enter numbers such as 1, 2, 3, 4 or 5 in a numeric column. By creating value labels that correspond to each of those numbers, you can have the strings appear in all output in place of the corresponding numbers. |
 |
Increased Data CapacityVersion 17 has been enhanced so that it can handle larger data sets than earlier versions. Rather than loading all of the data into the databook, only a limited number of records are loaded at any time for viewing. The algorithms for calculating various statistics have also been reworked to handle more data. |
 |
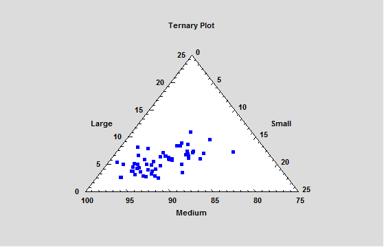
Ternary PlotsThis new procedure may be used to create a scatterplot of 3 variables which always sum to a constant value. It shows the values of the variables on a plot shaped like an equilateral triangle. It is sometimes called asimplex plot or a de Finetti diagram. |
 |
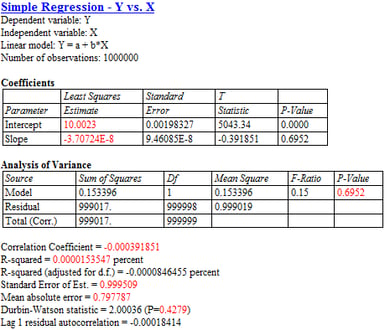
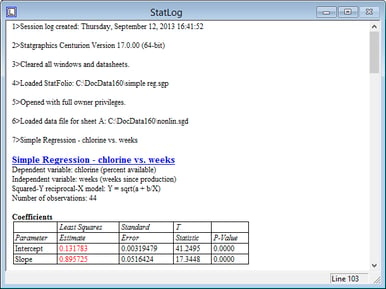
Session Log (StatLog)A new window called the StatLog appears by default whenever Statgraphics is loaded. The StatLog stores information about the current session. Certain information is always included, such as the opening and closing of files and the creation of analysis windows. Other information, such as the contents of statistical tables and graphs, is only included if specified on the Preferences dialog box. |
 |
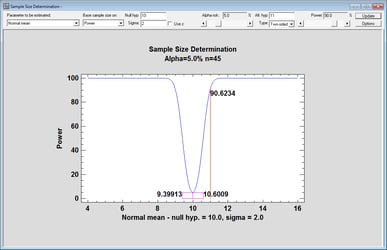
Sample Size Determination StatletThis new Statlet determines the sample size needed to estimate or test values of various parameters. The size may be based on either the width of a confidence interval or the power of a hypothesis test. Parameters for which sample sizes may be determined include means, standard deviations, proportions, rates, capability indices, and correlation coefficients. |
 |
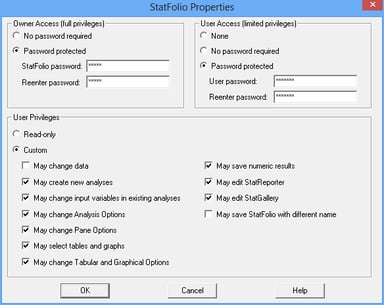
StatFolio PasswordsBoth owner and user passwords may now be added to a StatFolio. Owners have unlimited privileges and may change a StatFolio in any manner. Users are limited to the privileges specified on the dialog box. |
 |
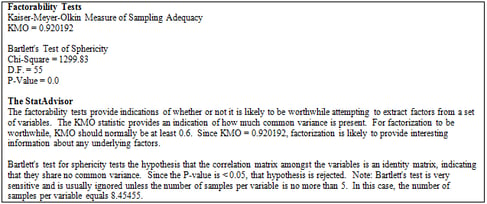
Factorability TestsNew tests have been added to theFactor Analysis and Principal Components procedures to determine whether it is useful to extract factors from a set of variables. The factorability tests include the Kaiser-Meyer-Olsen (KMO) measure of sampling adequacy and Bartlett’s test of sphericity. |
 |
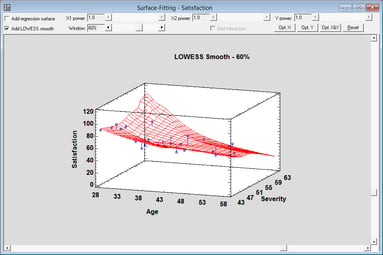
Surface-Fitting StatletThis new procedure estimates response surfaces involving a dependent variable Y and two independent variables X1 and X2. Surfaces may be estimated using either a parametric model or a nonparametric LOWESS smooth. |
 |

© 2025 Statgraphics Technologies, Inc.
The Plains, Virginia
CONTACT US
Have you purchased Statgraphics Centurion or Sigma Express and need to download your copy?
CLICK HERE


