


Quality Management. When beginning a Six Sigma project, it is important to understand the problem to be addressed and the factors that most effect quality and cost. Statgraphics Centurion XVII Lean Six Sigma software contains several procedures and Six Sigma analysis tools that are helpful in this area.

Measurement Systems Analysis. When implementing any statistical method that relies on data, it is important to be sure that the systems that collect that data are both accurate and precise with Six Sigma analysis tools. A set of procedures, often referred to as "Gage Studies", are widely used to assess the quality of measurement systems and analysis like this can be done with Lean Six Sigma software.

Process Capability Analysis. An important technique used to determine how well a process meets a set of specification limits is called a process capability analysis and can be done with our Lean Six Sigma software. A capability analysis is based on a sample of data taken from a process and usually produces: 1. An estimate of the DPMO (defects per million opportunities). 2. One or more capability indices. 3. An estimate of the Sigma Quality Level at which the process operates.

Statistical Process Control Charts. One of the most important actions that can help maintain the quality of any good or service is to collect relevant data consistently over time, plot it, and examine the plots carefully. All statistical process control charts plot data (or a statistic calculated from data) versus time, with control limits and Six Sigma analysis tools designed to alert the analyst to events beyond normal sampling variability.

Design of Experiments. Statgraphics contains extensive capabilities for the creation and analysis of statistically designed experiments. The designs that can be created are divided into several types such as response surface designs which are intended to determine the optimal settings of the experimental factors. The designs involve at least 3 levels of the experimental factors: Box-Behnken designs, 3-level factorials, and Draper-Lin designs.

Life Data Analysis and Reliability. Determining the reliability of manufactured items often requires performing a life test and analyzing observed times to failure. Such data is frequently censored, in that some items being tested may not have failed when the test is ended. In addition, it may be necessary to accelerate failure times by changing the value of an influential variable such as temperature. For all of these reasons, special tools are needed to deal with this type of data.
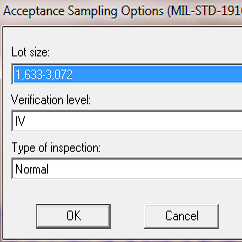
Acceptance Sampling. When lots containing a relatively large number of items require inspection, acceptance sampling plans can provide reasonable protection against shipping or receiving an unacceptable fraction of non-conforming items without inspecting 100% of the lot. The Acceptance Sampling procedures generate acceptance sampling plans by on either attributes or variables.
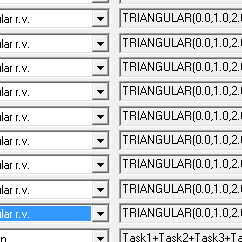
Monte Carlo Simulation. Monte Carlo simulation is used to estimate the distribution of variables when it is impossible or impractical to determine that distribution theoretically and it can be done with Statgraphics Lean Six Sigma software. It is used in many areas, including engineering, finance, and DFSS (Design for Six Sigma) but only with the proper Six Sigma analysis tools.

Training. Statpoint Technologies, Inc. and its worldwide dealers conduct both public and on-site seminars covering the use of Statgraphics Centurion for statistical analysis. The seminars are appropriate for both new and advanced users.

Support. Statpoint and its dealers are dedicated to providing first-class technical support. Statgraphics.com contains a large number of instructional videos, how-to guides and recorded webinars for its Lean Six Sigma tools and procedures. Our support specialists are also available by e-mail or phone and are highly knowledgeable about both Statgraphics and statistical methods.

Validation. Before release of each new version, extensive tests are performed to ensure that the program operates properly. For users needing to validate the statistical results for regulatory agencies, we will be happy to cooperate in providing information about our Lean Six Sigma software and development procedures.

© 2025 Statgraphics Technologies, Inc.
The Plains, Virginia
CONTACT US
Have you purchased Statgraphics Centurion or Sigma Express and need to download your copy?
CLICK HERE


