
Upgrade today to

Version 19 enhancements emphasize the increasing importance of combining data visualization with predictive analytics. Unlocking the information that is often hidden in collected data is the key for making correct decisions.


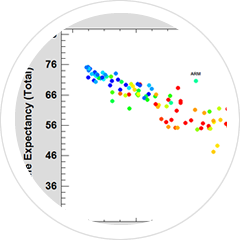
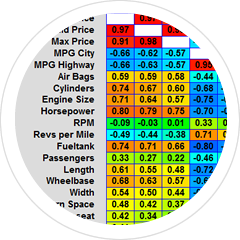
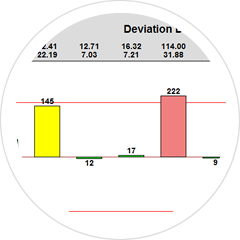
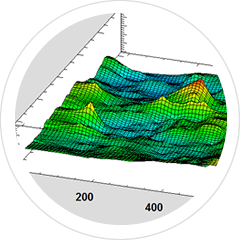
Centurion software for data visualization. Statgraphics 19 adds many new procedures for data visualization, including waterfall plots, heat maps, Venn diagrams, and missing data plots. Creating the proper view of your data is essential to extracting the key information that it contains. Identifying unusual observations or trends can lead to important discoveries.
Design of experiments. Breeze through projects. Reduce costs. The DOE Wizard steps you through each stage of the experimental design process. Statgraphics 19 adds new alias optimal designs that minimize the confounding from terms not included in the current model. It also includes a new capability for augmenting previously performed experiments by adding an optimal set of additional runs.
Quality management. Quality improvement made simple. Need SPC? Effortlessly kick your quality projects up a notch. Statgraphics 19 adds a new procedure for measurement systems analysis using a GLM based approach that can handle unbalanced data and additional factors. It also expands the number of locations where control chart limits may be recalculated, and adds a conformance analysis to the attribute capability analysis procedures.
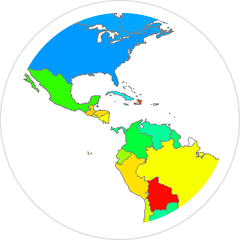
Heat maps. Heat maps use color gradients to show the value of a selected variable.. Statgraphics 19's interactive Statlets include animated maps that help visualize changes in the variable by letting time change dynamically.
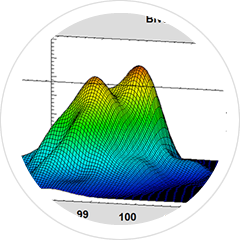
Distribution Fitting. Statgraphics 19 expands the list of distributions that may be fit to data. Included are mixtures of univariate and bivariate normal distributions, zero-inflated Poisson and negative binomial distributions, and Johnson distributions.
Statistical models. New procedures have been added to Statgraphics 19 for fitting piecewise linear regression models, quantile regressions, and zero-inflated count regression models. Also added is a procedure for setting shelf life based on a stability study with multiple batches. The new interface to Python accesses the Scikit-Learn library to perform K-means clustering.
Interested in learning more about all Statgraphics features?
Download the full features list!


Discover what the Six Sigma Toolbox can do for your process improvement


© 2025 Statgraphics Technologies, Inc.
The Plains, Virginia
CONTACT US
Have you purchased Statgraphics Centurion or Sigma Express and need to download your copy?
CLICK HERE


