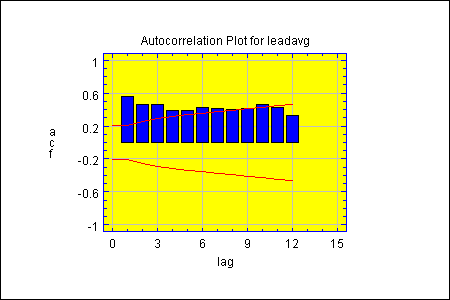
Purpose: Plots the sample autocorrelation function or partial autocorrelation function for a time series.
DataSource: any.

| Name | Type | Description | Possible Values | Default Value |
| confidenceLevel | double | Level of confidence for the probability limits as a percentage. | 0.0001-99.9999 | 95.0 |
| maximumLag | int | Maximum lag at which estimate in desired. | 1+ | 12 |
| partial | boolean | Whether to display partial autocorrelations. | true,false | false |
| probabilityLimitsColor | Color | The color of the probability limits. | Any valid Color. | Color.red |
| replaceMissingValues | boolean | Replace any missing values within time time series. | true,false | true |
| seasonalLength | int | The number of time periods comprising a season. | 1+ | 1 |
| showProbabilityLimits | boolean | Whether to display probability limits around zero. | true,false | true |
| timeSeriesVariableName | String | The name of the column with data values to be plotted. | Any string. | "" |
| Name | Description | Arguments | Return Value |
| double getAcfStandardError(int lag) | Returns the standard error of the estimated autocorrelation. | Lag (1-maximumLag). | Standard error. |
| double getAutocorrelation(int lag) | Returns the estimated autocorrelation. | Lag (1-maximumLag). | Estimated coefficient. |
| int getNumberOfMissingValuesReplaced() | Returns the number of missing values replaced with estimates. | None. | Number replaced. |
| double getPacfStandardError(int lag) | Returns the standard error of the estimated partial autocorrelation. | Lag (1-maximumLag). | Standard error. |
| double getPartialAutocorrelation(int lag) | Returns the estimated partial autocorrelation. | Lag (1-maximumLag). | Estimated coefficient. |

© 2023 Statgraphics Technologies, Inc.
The Plains, Virginia
CONTACT US
Have you purchased Statgraphics Centurion or Sigma Express and need to download your copy?
CLICK HERE