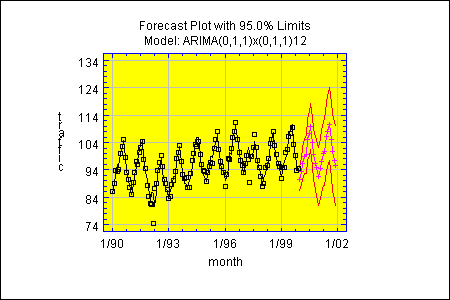
Purpose: Plots forecast for a time series. Allows Statgraphics to create a time series forecasting model.
Time Series Visualization DataSource: TimeSeriesForecast.

| Name | Type | Description | Possible Values | Default Value |
| confidenceLimitsColor | Color | The color of the confidence limits. | Any valid Color. | Color.red |
| forecastColor | Color | The color of the forecasts. | Any valid Color. | Color.magenta |
| lastPeriodsToPlot | int | The number of data values to plot in addition to the forecasts. | 0+, or -1 for all | -1 |
| showConfidenceLimits | boolean | Whether to display confidence limits for the forecasts. | true,false | true |
Other properties for creating a time series forecasting model are inherited from the java.awt.Canvas class and from the general GraphicalStatbean class.
Time Series Visualization Tool Code Sample
//create a datasource bean
FileDataSource fileDataSource1 = new STATBEANS.FileDataSource();
//set the file name to be read
fileDataSource1.setFileName("c:\\statbeans\\samples\\bridge.txt");
//create a forecasting bean
TimeSeriesForecast forecast1 = new STATBEANS.TimeSeriesForecast();
//set variable name
forecast1.setTimeSeriesVariableName("traffic");
//set time scale
forecast1.setTimeScale("month");
forecast1.setStartTime("1/86");
forecast1.setSeasonalLength(12);
//set number of forecasts desired
forecast1.setNumberOfForecasts(24);
//set model type and parameters
forecast1.setModelType("ARIMA");
forecast1.setArimaD(1);
forecast1.setArimaMA(1);
forecast1.setArimaSD(1);
forecast1.setArimaSMA(1);
forecast1.setArimaIncludeConstant(false);
//create a plot bean
TimeSeriesForecastPlot plot1 = new STATBEANS.TimeSeriesForecastPlot();
//set plot features
plot1.setBounds(36,12,450,300);
plot1.setHighlightPointOnMouseClick(true);
plot1.setShowPointClickedMessage(true);
//restrict amount of historical data plotted
plot1.setLastPeriodsToPlot(120);
//add the plot to the application frame
add(plot1);
//make the forecasting bean a listener for changes in the FileDataSource bean
fileDataSource1.addDataChangeListener(forecast1.listenerForDataChange);
//make the plot bean a listener for changes in the forecasting bean
forecast1.addDataChangeListener(plot1.listenerForDataChange);
//instruct the fileDataSource bean to read the file
fileDataSource1.readData();

© 2023 Statgraphics Technologies, Inc.
The Plains, Virginia
CONTACT US
Have you purchased Statgraphics Centurion or Sigma Express and need to download your copy?
CLICK HERE