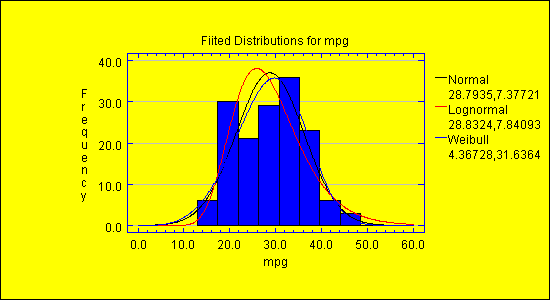
Purpose: A distribution fitting tool that plots the results of fitting one or more probability distributions to a column of data.
Distribution Fitting Tool DataSource: FitDistribution.

| Name | Type | Description | Possible Values | Default Value |
| by | double | Width of intervals (continuous data only). | Any double value > 0. | 0.1 |
| fillColor | Color | Color to use for the bars. | Any valid Color. | Color.blue. |
| from | double | Lower limit for first interval (numeric data only). | Any double value. | 0.0 |
| resolution | int | For continuous distributions, the number of points at which the function is calculated. | 50+ | 500 |
| scaleByPercentage | boolean | Whether to scale the axes by percentage rather than frequency. | true,false | false |
| to | double | Upper limit for last interval (numeric data only). | Double value > from. | 1.0 |
| Name | Description | Arguments | Return Value |
| double getLowerLimit() | Returns lower limit of first class. | None. | Lower limit. |
| int getNumberOfClasses() | Returns the number of classes. | None. | Number of classes. |
| double getUpperLimit() | Returns upper limit of last class. | None. | Upper limit. |

© 2025 Statgraphics Technologies, Inc.
The Plains, Virginia
CONTACT US
Have you purchased Statgraphics Centurion or Sigma Express and need to download your copy?
CLICK HERE