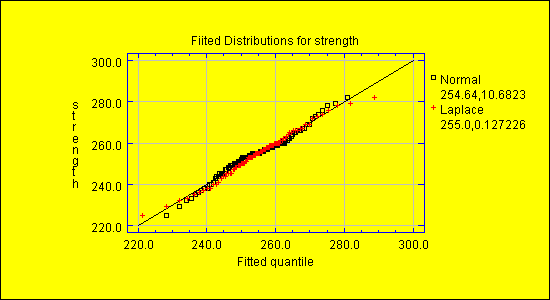
Code Sample For Normal QQ Plot Interpretation
//create a datasource bean
FileDataSource fileDataSource1 = new STATBEANS.FileDataSource();
//set the file name to be read
fileDataSource1.setFileName("c:\\statbeans\\samples\\spc.txt");
//create a calculation bean
FitDistribution fitdistribution1 = new STATBEANS.FitDistribution();
//set the column to be fit
fitdistribution1.setXVariableName("strength");
//set the number and type of distributions to be fit
fitdistribution1.setNDists(2);
fitdistribution1.setDistributionName("Normal",0);
fitdistribution1.setDistributionName("Laplace",1);
//create a plot bean
FitDistributionQQPlot fitdistributionqqplot1 = new STATBEANS.FitDistributionQQPlot();
//add the beans to the display
add(fitdistributionqqplot1);
//make the tabulation bean a listener for changes in the FileDataSource bean
fileDataSource1.addDataChangeListener(fitdistribution1.listenerForDataChange);
//make the other bean a listener for changes in the tabulation bean
fitdistribution1.addDataChangeListener(fitdistributionqqplot1.listenerForDataChange);
//instruct the fileDataSource bean to read the file
fileDataSource1.readData();


