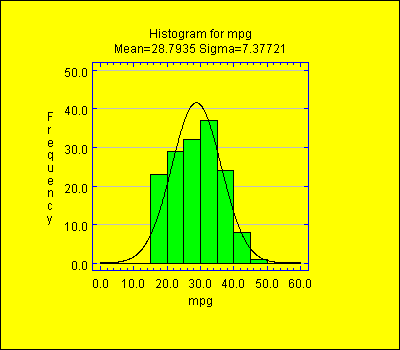
Purpose: Histogram generator that creates plots to show the distribution of numeric data. Allows Statgraphics to function as histogram plotter. See how tools like Statgraphics Centurion XVII or stratus can help with visualizations like histograms. Contact us For more information on our histogram software.
DataSource For The Frequency Histogram Maker: Tabulation.

| Name | Type | Description | Possible Values | Default Value |
| drawNormalCurve | boolean | Whether to add the best-fitting normal distribution. | true,false | false |
| drawVertical | boolean | Whether to make the bars vertical. | true,false | true |
| fillColor | Color | Color to use for the bars. | Any valid Color. | Color.blue. |
| resolution | int | For continuous distributions, the number of points at which the function is calculated. | 50+ | 500 |
| scaleByPercentage | boolean | Whether to scale the axes by percentage rather than frequency. | true,false | false |

© 2025 Statgraphics Technologies, Inc.
The Plains, Virginia
CONTACT US
Have you purchased Statgraphics Centurion or Sigma Express and need to download your copy?
CLICK HERE