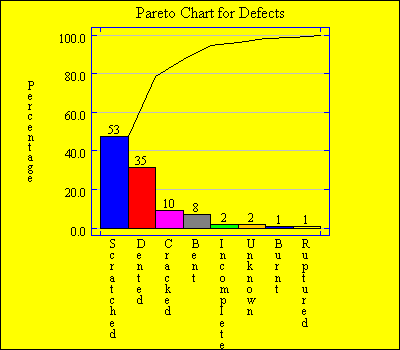
Purpose: Pareto analysis software that constructs a Pareto chart to display the most common causes of problems or defects. A STATBEAN that acts as Pareto chart software in Statgraphics.
DataSource for pareto analysis software: any (automatic data transfer if Tabulation).

| Name | Type | Description | Possible Values | Default Value |
| barColor | Color array | The colors to be used for the bars. | Any valid Color. | Various. |
| barLabelColor | Color | The color of the bar labels. | Any valid Color. | Color.black |
| barLabelFont | Font | The font to be used for the bar labels. | Any Font. | "Serif",0,12 |
| barLabels | String | Labels to add at end of bars. | "None","Class","Frequency","Percentage". | "None" |
| barWidth | int | Percentage of available space used by bars (affects bar gap). | 1-100 | 90 |
| className | String | Name for classes to be used in title. | Any string. | "" |
| cumulativeBars | boolean | Whether to locate the bars at cumulative positions. | true,false | false |
| cumulativeLine | boolean | Whether to plot a cumulative line across the top of the bars. | true,false | true |
| decimalPlaces | int | Number of decimal places for displaying frequencies. | 0+, or -1 for default. | -1 |
| drawVertical | boolean | Whether to make the bars vertical. | true,false | true |
| frequencyVariableName | String | The name of the column containing class frequencies. | Any string. | "Frequency" |
| highlightBar | int | Number of the highlighted bar, if any. | 0 if none, else 1+. | 0 |
| highlightColor | Color | The color of the highlighted bar. | Any valid Color. | Color.red |
| labelVariableName | String | The name of the column containing class labels. | Any string. | "Label" |
| rotateClassLabels | boolean | Whether to rotate the class labels on the x-axis. | true,false | true |
| scaleByPercentage | boolean | Whether to show percentages on the Y axis. | true,false | true |
| useOneColor | boolean | Whether to draw all bars (except the highlighted one) in a single color. | true,false | true |
| weightVariableName | String | The name of the column containing optional class weights. | Any string. | "" |

© 2025 Statgraphics Technologies, Inc.
The Plains, Virginia
CONTACT US
Have you purchased Statgraphics Centurion or Sigma Express and need to download your copy?
CLICK HERE