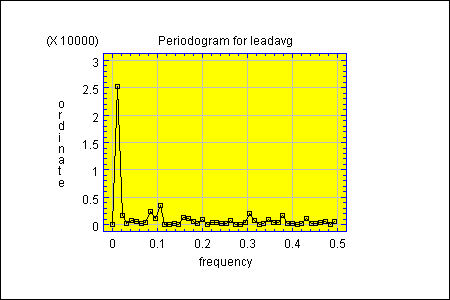
Purpose: Plots a periodogram or integrated periodogram for a time series for visual periodogram analysis.
DataSource: any.

| Name | Type | Description | Possible Values | Default Value |
| integrated | boolean | Whether to plot a cumulative periodogram. | true,false | false |
| probabilityLimitsColor | Color | The color of the probability limits. | Any valid Color. | Color.red |
| removeMean | boolean | Whether to subtract mean from time series before calculating periodogram. | true,false | true |
| seasonalLength | int | The number of time periods comprising a season. | 1+ | 1 |
| showProbabilityLimits | boolean | Whether to display 95% and 99% Kolmogorov-Smirnov limits on an integrated plot. | true,false | true |
| taper | double | Amount of tapering to apply at each end of time series (as a percentage). | 0.0-50.0 | 0.0 |
| timeSeriesVariableName | String | The name of the column with data values to be plotted. | Any string. | "" |
| Name | Description | Arguments | Return Value |
| double getCumulativeSum(int i) | Returns the sum of the first i+1 ordinates. | Index. | Cumulative sum. |
| double getFrequency(int i) | Returns the i-th Fourier frequency. | Index. | Frequency. |
| int getNumberOfMissingValuesReplaced() | Returns the number of missing values replaced with estimates. | None. | Number replaced. |
| int getNumberOfOrdinates() | Returns the number of ordinates (or frequencies). | None. | Number. |
| double getOrdinate(int i) | Returns the periodogram ordinate at the i-th frequency. | Index. | Ordinate. |
| double getSum() | Returns the sum all the ordinates. | None. | Sum. |
| int getSampleSize() | Returns the number of data values used to obtain estimates. | None. | Sample size. |

© 2025 Statgraphics Technologies, Inc.
The Plains, Virginia
CONTACT US
Have you purchased Statgraphics Centurion or Sigma Express and need to download your copy?
CLICK HERE