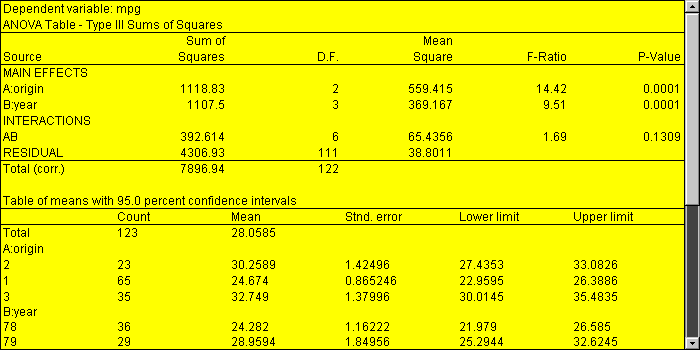
Purpose: Displays the results of a multifactor analysis of variance.
DataSource: Anova.

AnovaTable Read/Write Properties
| Name | Type | Description | Possible Values | Default Value |
| confidenceLevel | double | Level of confidence for the intervals. | 0.0001-99.9999 | 95.0 |
| intervalType | int | Type of intervals. | 0=none,1=standard error 2=confidence,3=LSD 4=Tukey HSD,5=Sheffe 6=Bonferroni |
95.0 |
| showMeans | boolean | Whether to display least squares means and standard deviations. | true,false | false |
| showANOVA | boolean | Whether to display the analysis of variance table. | true,false | true |
| showCoefficients | boolean | Whether to display the estimated regression coefficients. | true,false | true |
| showDependentVariable | boolean | Whether to display the name of the dependent variable. | true,false | true |
| showStatistics | boolean | Whether to display summary statistics for the regression. | true,false | true |
| type3SumsOfSquares | boolean | Whether to display type 3 sums of squares instead of type 1. | true,false | true |
Other properties for the AnovaTable StatBean are inherited from the java.awt.Panel class and from the general TabularStatbean class.
AnovaTable Code Sample - see Anova.

© 2025 Statgraphics Technologies, Inc.
The Plains, Virginia
CONTACT US
Have you purchased Statgraphics Centurion or Sigma Express and need to download your copy?
CLICK HERE