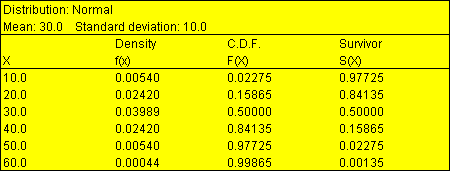
Purpose: Constructs a probability distribution table displaying probabilities and other information about probability distributions. Let Statgraphics function as a visual probability distribution calculator.
DataSource: Distributions or FitDistribution.

Read/Write Properties:
| Name | Type | Description | Possible Values | Default Value |
| decimalPlaces | int | Number of decimal places for displaying frequencies. | 0+, or -1 for default. | 5 |
| includePdf | boolean | Whether to include a column showing the density or mass function. | true,false | true |
| includeCdf | boolean | Whether to include a column showing the cumulative distribution. | true,false | true |
| includeSurvivor | boolean | Whether to include a column showing the survivor probabilities. | true,false | true |
| includeLogSurvivor | boolean | Whether to include a column showing the log of the survivor probabilities. | true,false | false |
| includeHazard | boolean | Whether to include a column showing the hazard function. | true,false | false |
| inputLowerTailAreas | boolean | Whether the input consists of tail area probabilities (true) or values of the random variable (false). | true,false | false |
| values | double[] | Values at which results are desired. | Tail areas or values of X | 1.0 |
Code Sample - see Distributions.

© 2025 Statgraphics Technologies, Inc.
The Plains, Virginia
CONTACT US
Have you purchased Statgraphics Centurion or Sigma Express and need to download your copy?
CLICK HERE