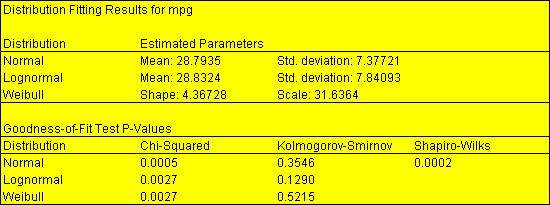
Purpose: Constructs a table displaying the results of fitting one or more probability distributions to a column of data. This STATBEAN lets Statgraphics act as a goodness of fit calculator to perform fit distribution to data analysis and visualization.
DataSource: FitDistribution.

Read/Write Properties:
| Name | Type | Description | Possible Values | Default Value |
| includeChiSquaredTest | boolean | Whether to include the results of a chi-squared test. | true,false | true |
| includeEstimates | boolean | Whether to include the parameter estimates. | true,false | true |
| includeHeader | boolean | Whether to include header at top of page. | true,false | true |
| includeKolmogorovSmirnov | boolean | Whether to include the results of a Kolmogorov-Smirnov test. | true,false | true |
| includeShapiroWilks | boolean | Whether to include the results of a Shapiro-Wilks test (normal distribution only). | true,false | true |
Code Sample - see FitDistribution.

© 2025 Statgraphics Technologies, Inc.
The Plains, Virginia
CONTACT US
Have you purchased Statgraphics Centurion or Sigma Express and need to download your copy?
CLICK HERE