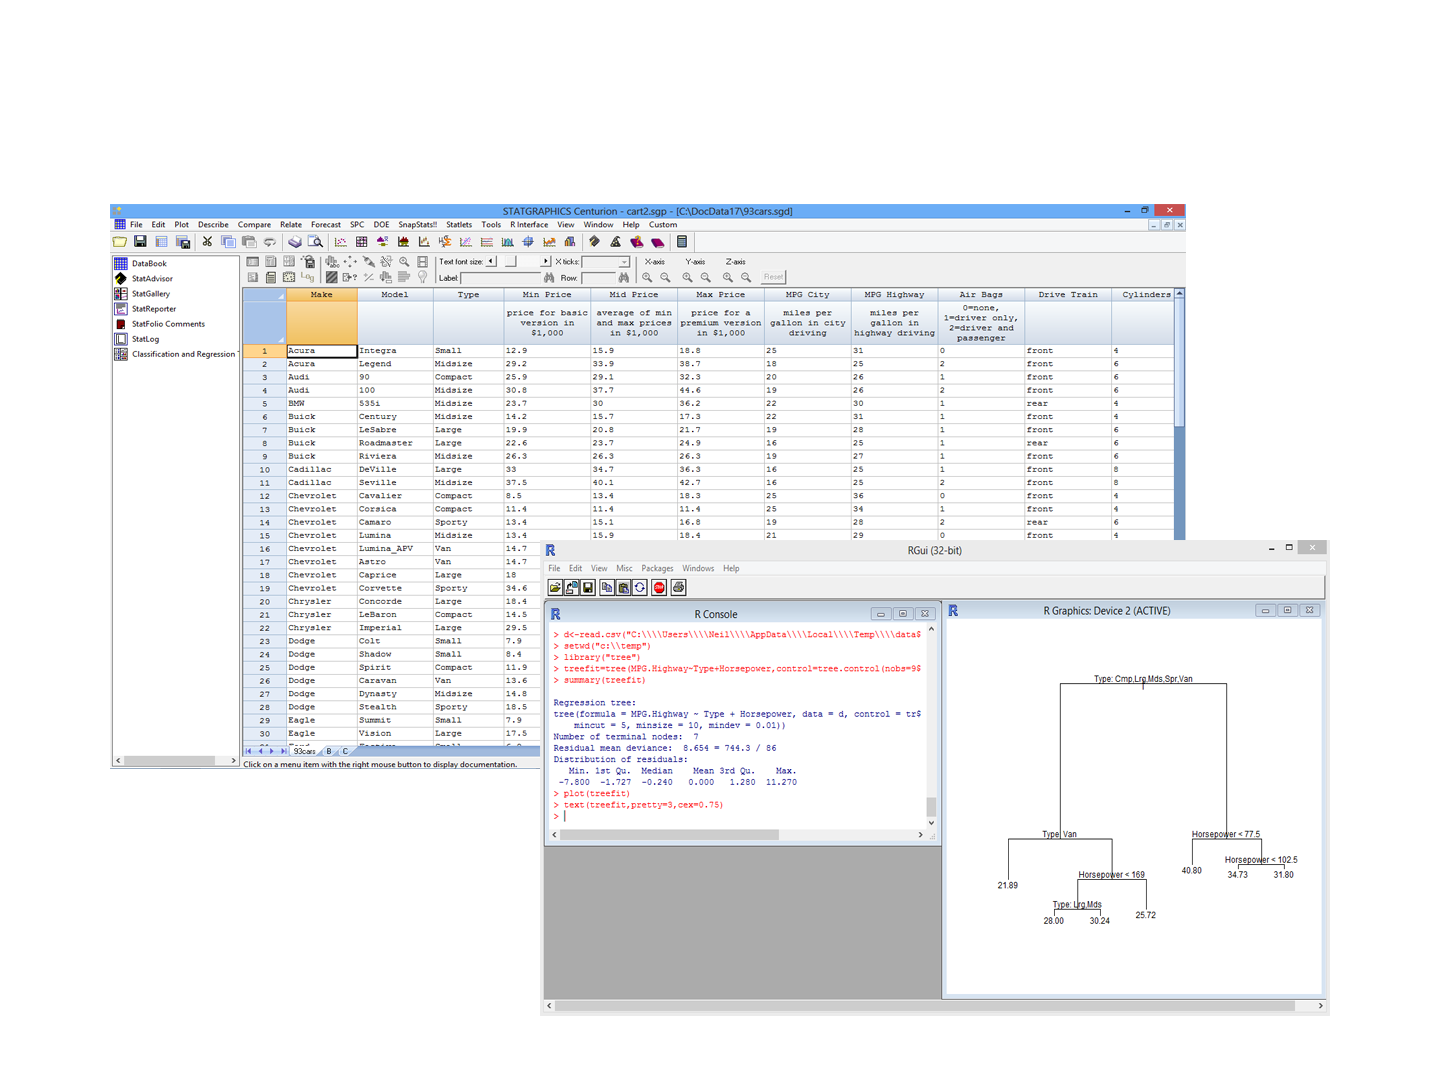
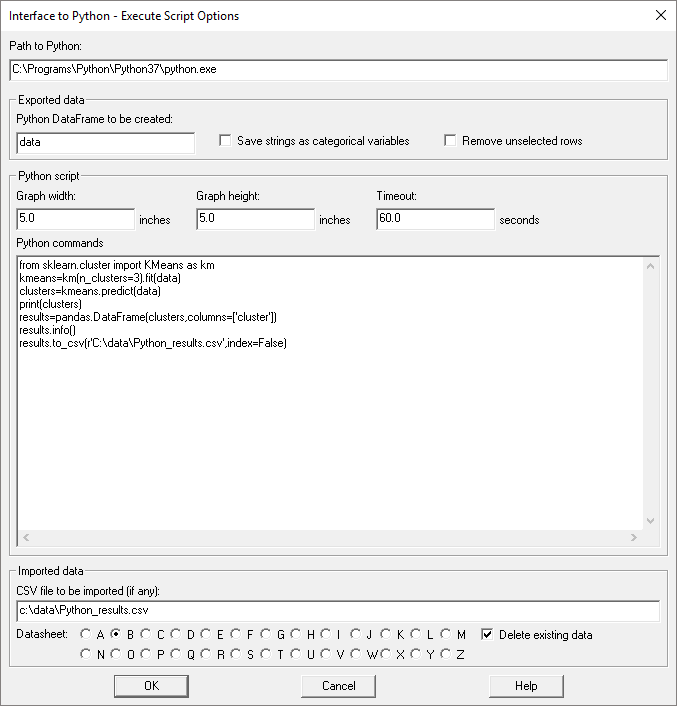
Statgraphics new Python software interface adds a new realm of possibilities to the most user friendly statistical package on the market. Whether you prefer to point and click, or to code your own procedures, Statgraphics now has even more ways to make your life easier.


It's now a breeze to...
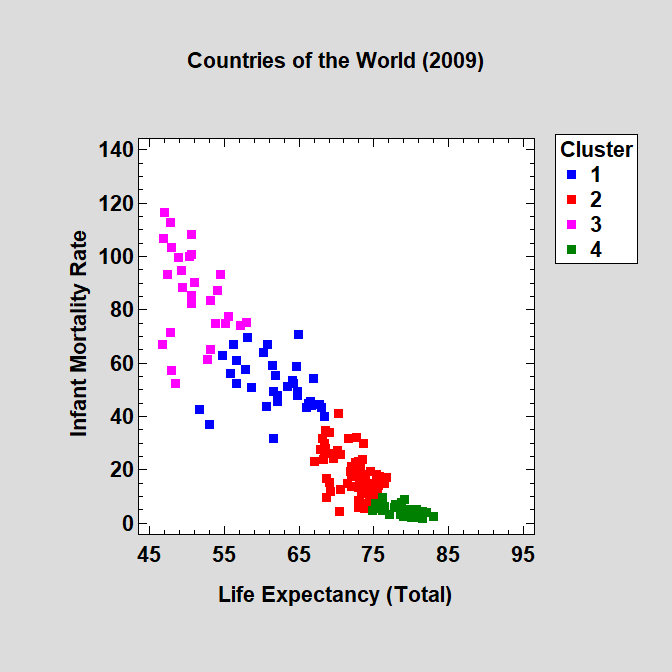
In areas such as market research, pattern recognition, document analysis, and many other fields, it is very useful to divide large samples of multivariate observations into smaller clusters within which the members exhibit distinct similarities. Statgraphics 19 provides a dialog-based interface to the K-Means Clustering procedure in the Python Scikit-Learn package. Simply specify the columns of the Statgraphics DataBook that should be used to form the clusters and the number of clusters desired, and Statgraphics will automatically create a script, send it to Python, and retrieve the resulting clusters. Statgraphics will then create various tables and graphs to display the results.


© 2025 Statgraphics Technologies, Inc.
The Plains, Virginia
CONTACT US
Have you purchased Statgraphics Centurion or Sigma Express and need to download your copy?
CLICK HERE