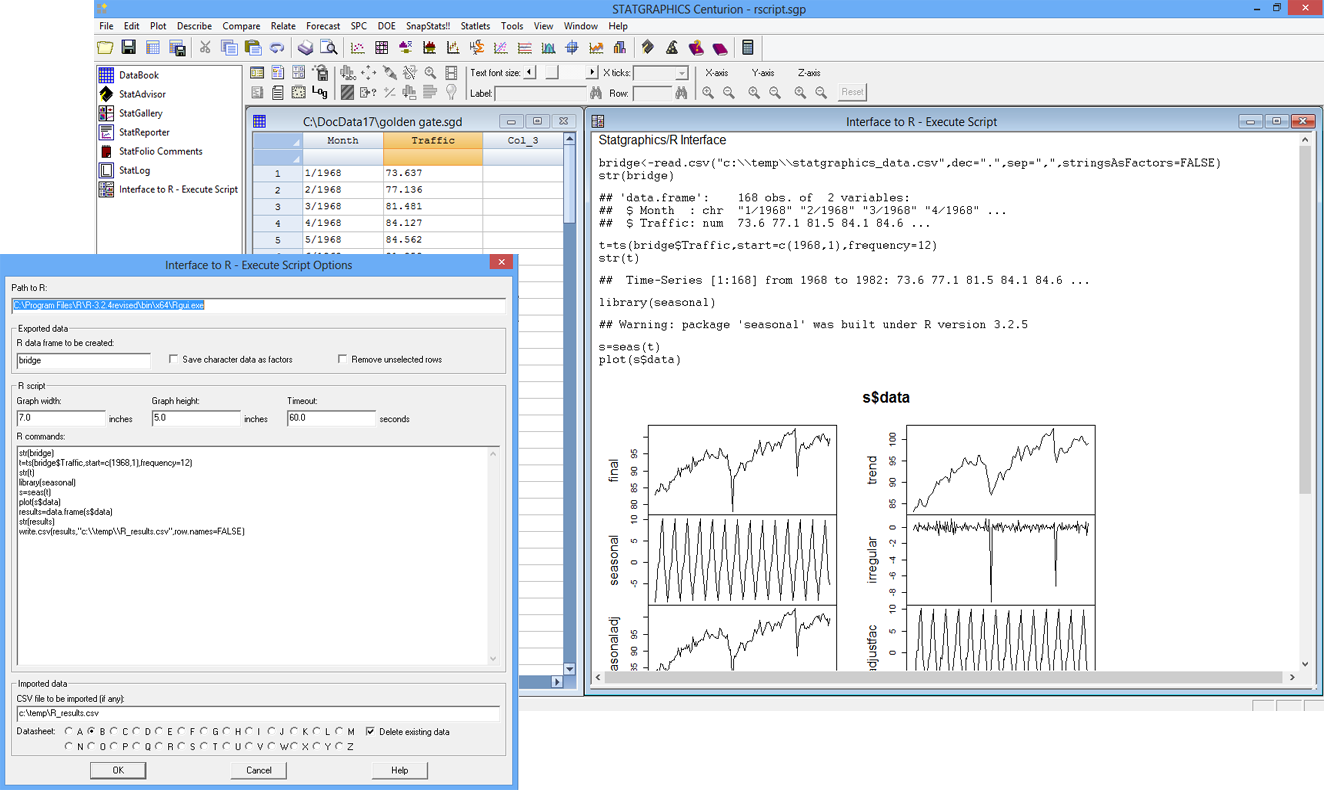
Introducing Statgraphics' new R interface...

All the power of R, within Statgraphics Centurion...

Extend the capabilities of Statgraphics using the thousands of free R libraries.

Statgraphics new R statistics software interface adds a new realm of possibilities to the most user friendly statistical package on the market. Whether you prefer to point and click, or to code your own procedures, Statgraphics now has even more ways to make your life easier. 
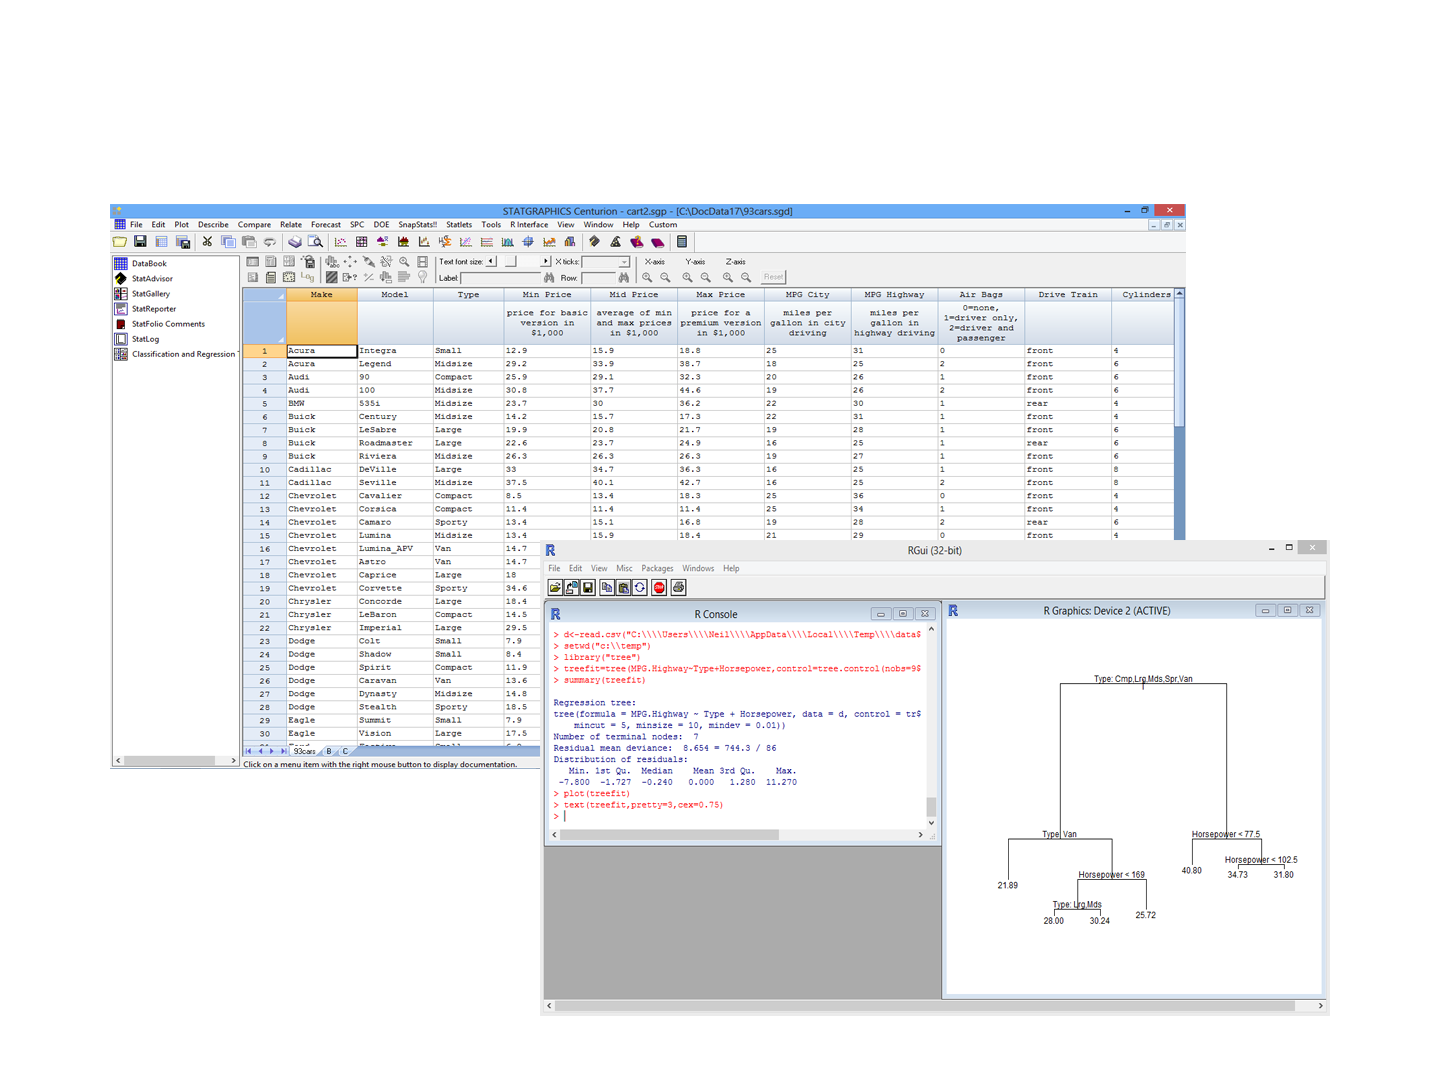
  • Run Statgraphics and R side-by-side, sharing the same data.
  • Grab the results from the R statistical software and incorporate them in the StatReporter.
  • Save sequences of R commands in a StatFolio for automatic execution.
R_screenshot_2.png
R_screenshots_version_1_png.png


Create your own procedures with our R statistical program and make them available to your colleagues who prefer to point and click.

It's now a breeze to...

  • Transfer your data between Statgraphics and R statistics software.
  • Create a sequence of R commands and store them in a StatFolio.
  • Have R run the commands and return the output to Statgraphics.

Example: Text Mining

Data are not just numbers! There's much to learn from examining text.

Extracting information from text such as survey responses, emails and social media can reveal a lot about its source. Send the R statistical program a column of character data or a list of documents and dig in.

Text mining can:

  • Find the terms that occur most commonly.
  • Display those words as a wordcloud.
  • Compare different sources of data.
wordcloud.png