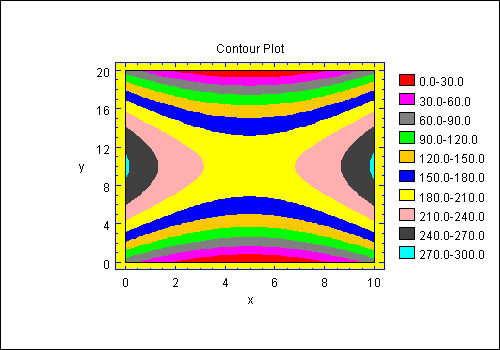
Purpose: Contour plot software that creates contour plots for a response surface. This STATBEAN lets Statgraphics function as graph plotting software.
DataSource For Contour Plot Software: any.

| Name | Type | Description | Possible Values | Default Value |
| addPoints | boolean | Whether to add points around the surface. | true,false | false |
| contoursBy | double | The distance between the contours. | Any double > 0. | missing |
| contoursFrom | double | The level at which the first contour should be plotted. | Any double. | missing (causes default scaling) |
| contoursTo | double | The level at which the last contour should be plotted. | Any double > contoursFrom. | missing |
| contourType | String | The type of contours to be plotted. | "Lines", "Regions" |
"Regions" |
| gridSize | int | The number of values along each dimension of the matrix which defines the surface. | 2+ | 21 |
| xMaximum | double | The maximum value of X in the grid matrix. | Any double > xMinimum. | 1.0 |
| xMinimum | double | The minimum value of X in the grid matrix. | Any double. | 0.0 |
| xVariableName | String | The name of the column with data values to be plotted (if any). | Any string. | "X" |
| yMaximum | double | The maximum value of Y in the grid matrix. | Any double > yMinimum. | 1.0 |
| yMinimum | double | The minimum value of Y in the grid matrix. | Any double. | 0.0 |
| yVariableName | String | The name of the column with data values to be plotted (if any). | Any string. | "Y" |
Other properties are inherited from the java.awt.Canvas class and from the general GraphicalStatbean class for this contour plot software.
Contour Mapping Software Code Sample
//create a datasource bean
FileDataSource fileDataSource1 = new STATBEANS.FileDataSource();
//set the file name to be read
fileDataSource1.setFileName("c:\\statbeans\\samples\\cardata.txt");
//create a plot bean
ContourPlot contourPlot1 = new STATBEANS.ContourPlot();
//set limits for the x and y dimensions
double xmin=0.0;
double xmax=10;
double ymin=0.0;
double ymax=20.0;
contourPlot1.setXMinimum(xmin);
contourPlot1.setXMaximum(xmax);
contourPlot1.setYMinimum(ymin);
contourPlot1.setYMaximum(ymax);
//set the number of points along each axis
int n=41;
contourPlot1.setGridSize(n);
//create a matrix with the height of the surface
double grid[][]=new double[n][n];
for(int i=0; i<n; i++)
{
double x=xmin+i*xmax/(n-1);
for(int j=0; j<n; j++)
{
double y=ymin+j*ymax/(n-1);
grid[i][j]=200.0+3*(x-5)*(x-5)-2*(y-10)*(y-10);
}
}
contourPlot1.setSurfaceGrid(grid);
//position the legend
contourPlot1.setLegendVerticalPosition(1.1);
contourPlot1.setLegendHorizontalPosition(1.1);
//add the plot to the application frame
add(contourPlot1);
//make the plot a listener for changes in the ProgramDataSource bean
programDataSource1.addDataChangeListener(contourPlot1.listenerForDataChange);
//notify all listeners
programDataSource1.updateListeners();

© 2025 Statgraphics Technologies, Inc.
The Plains, Virginia
CONTACT US
Have you purchased Statgraphics Centurion or Sigma Express and need to download your copy?
CLICK HERE