DotPlot STATBEAN®


Purpose: Displays a dot frequency visualization for a column of numeric data.

DataSource For Dot Frequency Visualization: any. 
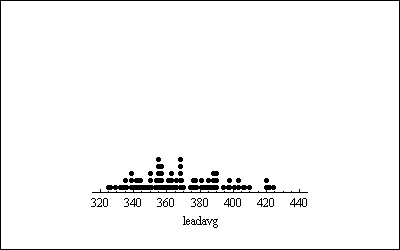
dotplot


Read/Write Properties
Name Type Description Possible Values Default Value
xVariableName String The name of the column with data values to be plotted on the horizontal axis. Any string. "X"

Other properties are inherited from the java.awt.Canvas class and from the general GraphicalStatbean class. 

Code Sample 

//create a datasource bean 
FileDataSource fileDataSource1 = new STATBEANS.FileDataSource(); 

//set the file name to be read 
fileDataSource1.setFileName("c:\\statbeans\\samples\\baseball.txt"); 

//set the delimiter character used in the file 
fileDataSource1.setDelimiter("tab"); 

//create a plot bean 
DotPlot dotPlot1 = new STATBEANS.DotPlot(); 

//set the data column 
dotPlot1.setXVariableName("leadavg"); 

//turn on point identifcation 
dotPlot1.setHighlightPointOnMouseClick(true); 
dotPlot1.setShowPointClickedMessage(true); 

//add the plot to the application frame 
add(dotPlot1); 

//make the plot a listener for changes in the FileDataSource bean 
fileDataSource1.addDataChangeListener(dotPlot1.listenerForDataChange); 

//instruct the fileDataSource bean to read the file 
fileDataSource1.readData();