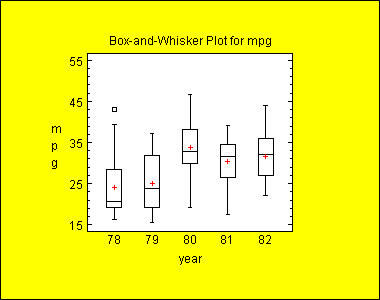
Purpose: Displays a box-and-whisker plot of one numeric variable versus levels of an experimental factor. Lets Statgraphics create a box and whisker plot using any data source.
Box And Whisker Plot Generator DataSource: any.

| Name | Type | Description | Possible Values | Default Value |
| boxWidth | int | Percentage of plotting area covered by the box. | 10-100 | 40 |
| confidenceLevel | double | Level of confidence for the prediction and confidence limits, as a percentage. | 0.0001-99.9999 | 95.0 |
| drawVertical | boolean | Whether to plot the percentages on the vertical axis. | true,false | true |
| factorVariableName | String | The name of the column with factor levels. | Any string. | "" |
| flagOutsidePoints | boolean | Whether to add point symbols showing values unusually far from the box. | true,false | true |
| meanSymbol | boolean | Whether to add a plus sign showing the sample mean. | true,false | true |
| medianNotch | boolean | Whether to add a notch showing a confidence interval for the median. | true,false | false |
| includeVariableName | String | The name of an optional column with values indicating which cases should be included (a non-zero value indicates inclusion). | Any string. | "" |
| labelSkipFactor | int | If >1, will skip (labelSkipFactor1-1) labels between each label displayed.. | 1+ | 1 |
| rotateClassLabels | boolean | Whether to make the bar labels vertical. | true,false | false |
| tablewiseExclusion | boolean | Whether all rows of the data table containing a missing value in any column should be excluded from the plot. | true,false | false |
| xVariableName | String | The name of the column with data values to be plotted. | Any string. | "" |
Other properties needed to create a box and whisker plot are inherited from the java.awt.Canvas class and from the general GraphicalStatbean class.
Code Sample
//create a datasource bean
FileDataSource fileDataSource1 = new STATBEANS.FileDataSource();
//set the file name to be read
fileDataSource1.setFileName("c:\\statbeans\\samples\\cardata.txt");
//create a chart bean
FactorBoxPlot plot1 = new STATBEANS.FactorBoxPlot();
plot1.setBackground(java.awt.Color.yellow);
plot1.setBounds(16,30,380,300);
//set the column to be plotted
plot1.setXVariableName("mpg");
//set the factor column
plot1.setFactorVariableName("year");
//set the direction
plot1.setDrawVertical(true);
//show the plot
add(plot1);
//make the plot bean a listener for changes in the FileDataSource bean
fileDataSource1.addDataChangeListener(plot1.listenerForDataChange);
//instruct the fileDataSource bean to read the file
fileDataSource1.readData();

© 2025 Statgraphics Technologies, Inc.
The Plains, Virginia
CONTACT US
Have you purchased Statgraphics Centurion or Sigma Express and need to download your copy?
CLICK HERE