
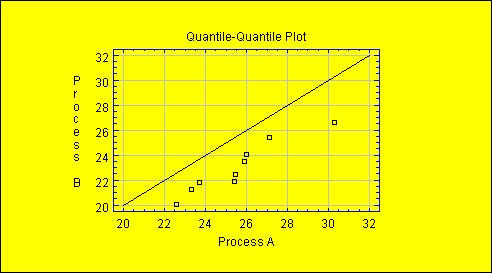
Purpose: Displays scatterplot of quantiles for two numeric columns. Allows Statgraphics to perform Quantile Quantile Plot (Q-Q Plot) Interpretation.
Q-Q Plot Interpretation DataSource: any.
| Name | Type | Description | Possible Values | Default Value |
| tablewiseExclusion | boolean | Whether all rows of the data table containing a missing value in any column should be excluded from the plot. | true,false | false |
| xVariableName | String | The name of the column with data values to be plotted on the horizontal axis. | Any string. | "X" |
| yVariableName | String | The name of the column with data values to be plotted on the vertical axis. | Any string. | "Y" |

© 2025 Statgraphics Technologies, Inc.
The Plains, Virginia
CONTACT US
Have you purchased Statgraphics Centurion or Sigma Express and need to download your copy?
CLICK HERE


