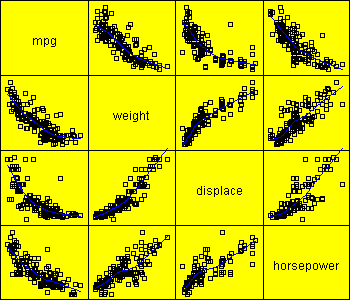
Purpose: - create a scatter plot graph matrix of 2-variables for several numeric columns.
Scatter Plot Matrix: Any.

| Name | Type | Description | Possible Values | Default Value |
| columnNames | String array | The names of the columns to be plotted. | One or more strings. | {""} |
| gap | double | The proportion of the plotting space left blank around each side of the cells of the plot. | 0.0-0.25 | 0.1 |
| labelColor | Color | The color of the variable labels. | Any valid Color. | Color.black |
| labelFont | Font | The font to be used for the variable labels. | Any Font. | "Serif",0,12 |
| missingValueExclusion | String | The method for handling records which contain missing values. | "Columnwise","Casewise", "Tablewise" |
"Columnwise" |
| smootherColor | Color | Color for drawing the smooth. | Any valid color. | Color.blue |
| smootherPercentage | int | Width of the smoother as a percentage of the number of observations. | 1-99 | 50 |
| smootherType | String | Type of smoother, if any, to be added to the plot. | "None", "Running Means", "Running Lines", "LOWESS", "Robust LOWESS" |
"None" |

© 2025 Statgraphics Technologies, Inc.
The Plains, Virginia
CONTACT US
Have you purchased Statgraphics Centurion or Sigma Express and need to download your copy?
CLICK HERE