
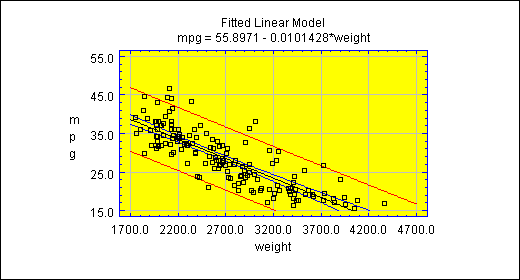
Purpose: Simple regression calculator that plots the fitted regression model relating Y and X.
DataSource to Create a Simple Regression Model: SimpleRegression or PolynomialRegression.
| Name | Type | Description | Possible Values | Default Value |
| confidenceLevel | double | Level of confidence for the prediction and confidence limits. as a percentage. | 0.0001-99.9999 | 95.0 |
| confidenceLimitsColor | Color | The color of the confidence limits. | Any valid Color. | Color.blue |
| predictionLimitsColor | Color | The color of the prediction limits. | Any valid Color. | Color.red |
| predictionMeanSize | int | The number of observations averaged in the value for which the prediction limits apply. | 1+ | 1 |
| resolution | int | The number of points along the horizontal axis used to draw the fitted line and limits. | 20-2000 | 200 |
| showConfidenceLimits | boolean | Whether to display confidence limits for the mean of Y. | true,false | true |
| showPredictionLimits | boolean | Whether to display prediction limits for new observations. | true,false | true |
| xFromY | boolean | Whether to plot limits using calibration option (locating x for a predicted y). | true,false | false |

© 2025 Statgraphics Technologies, Inc.
The Plains, Virginia
CONTACT US
Have you purchased Statgraphics Centurion or Sigma Express and need to download your copy?
CLICK HERE


