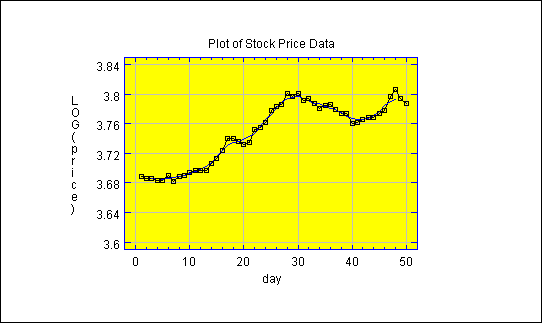
Purpose: The time series graph maker displays horizontal or vertical line plots of a numeric column versus time.
Time Series Plot DataSource: any.

| Name | Type | Description | Possible Values | Default Value |
| baseline | double | The base from which vertical lines extend in a vertical plot. | Any double | 0.0 |
| connected | boolean | Whether the points should be connected with a line. | true,false | false |
| drawVertical | boolean | Whether to create a vertical time sequence plot. | true,false | false |
| points | boolean | Whether point symbols should be plotted. | true,false | true |
| referenceLine | String | Type of additional reference line, if any, to be added to the plot. | "None", "Horizontal", "Vertical", "Diagonal" |
"None" |
| referenceLineColor | Color | Color for drawing the reference line. | Any valid color. | Color.black |
| referenceLineLocation | double | Location of a horizontal or vertical reference line. | Any double value. | 0.0 |
| samplingInterval | double | The length of time between consecutive data values. | Any double > 0.0 | 1.0 |
| smootherColor | Color | Color for drawing the smooth. | Any valid color. | Color.blue |
| smoothVariableName | String | The name of the column with smoothed data values. | Any string. | "" |
| startTime | String | The value of time associated with row 1. | Any string resulting in the proper type of value. | "1.0" |
| timeScale | String | The type of time units. | "Year","Quarter","Month","Day", "Hour","Minute","Second","Other" |
"Other" |
| timeSeriesVariableName | String | The name of the column with data values to be plotted. | Any string. | "" |
Other properties used by the time series graph maker are inherited from the java.awt.Canvas class and from the general GraphicalStatbean class.
Code Sample
//create a datasource bean
FileDataSource fileDataSource1 = new STATBEANS.FileDataSource();
//set the file name to be read
fileDataSource1.setFileName("c:\\statbeans\\samples\\stocks.txt");
//create a plot bean
TimeSeriesPlot plot1 = new STATBEANS.TimeSeriesPlot();
//create an adjustment bean
TimeSeriesAdjustments adjust1 = new STATBEANS.TimeSeriesAdjustments();
//take the logs of the time series data
adjust1.setTimeSeriesVariableName("price");
adjust1.setMathAdjustment("LOG");
//smooth the adjusted data
TimeSeriesSmoothing smooth1=new TimeSeriesSmoothing();
smooth1.setTimeSeriesVariableName("Adjusted Data");
smooth1.setSmoother1Type("MA");
smooth1.setSmoother1Span(5);
//override the top title
plot1.setTopTitleLine1("Plot of Stock Price Data");
//override the axis titles
plot1.setXaxisTitle("day");
plot1.setYaxisTitle("LOG(price)");
//set the variable names for plotting
plot1.setTimeSeriesVariableName("Adjusted Data");
plot1.setSmoothVariableName("Smoothed Data");
//add the plot to the application frame
add(plot1);
//make the adjustment bean a listener for changes in the FileDataSource bean
fileDataSource1.addDataChangeListener(adjust1.listenerForDataChange);
//make the smoothing bean a listener for changes in the adjustment bean
adjust1.addDataChangeListener(smooth1.listenerForDataChange);
//make the plot bean a listener for changes in the smoothing bean
smooth1.addDataChangeListener(plot1.listenerForDataChange);
//instruct the fileDataSource bean to read the file
fileDataSource1.readData();

© 2025 Statgraphics Technologies, Inc.
The Plains, Virginia
CONTACT US
Have you purchased Statgraphics Centurion or Sigma Express and need to download your copy?
CLICK HERE