
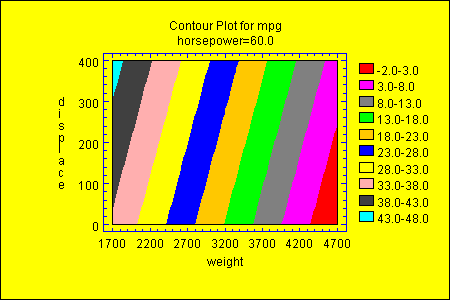
Purpose: - creates a contour plot of the response in a multiple regression model.
Contour Plotter DataSource: MultipleRegression.
| Name | Type | Description | Possible Values | Default Value |
| holdAt | double[nxvars] | Values for each x variable to be used in evaluating response (ignored for variables plotted on x and y axis). | Any double values. | Means of each variable. |
| xVariableNumber | int | Variable number in the model defining the x-axis. | 0+ | 0 |
| yVariableNumber | int | Variable number in the model defining the y-axis. | 0+ | 1 |

© 2025 Statgraphics Technologies, Inc.
The Plains, Virginia
CONTACT US
Have you purchased Statgraphics Centurion or Sigma Express and need to download your copy?
CLICK HERE


