
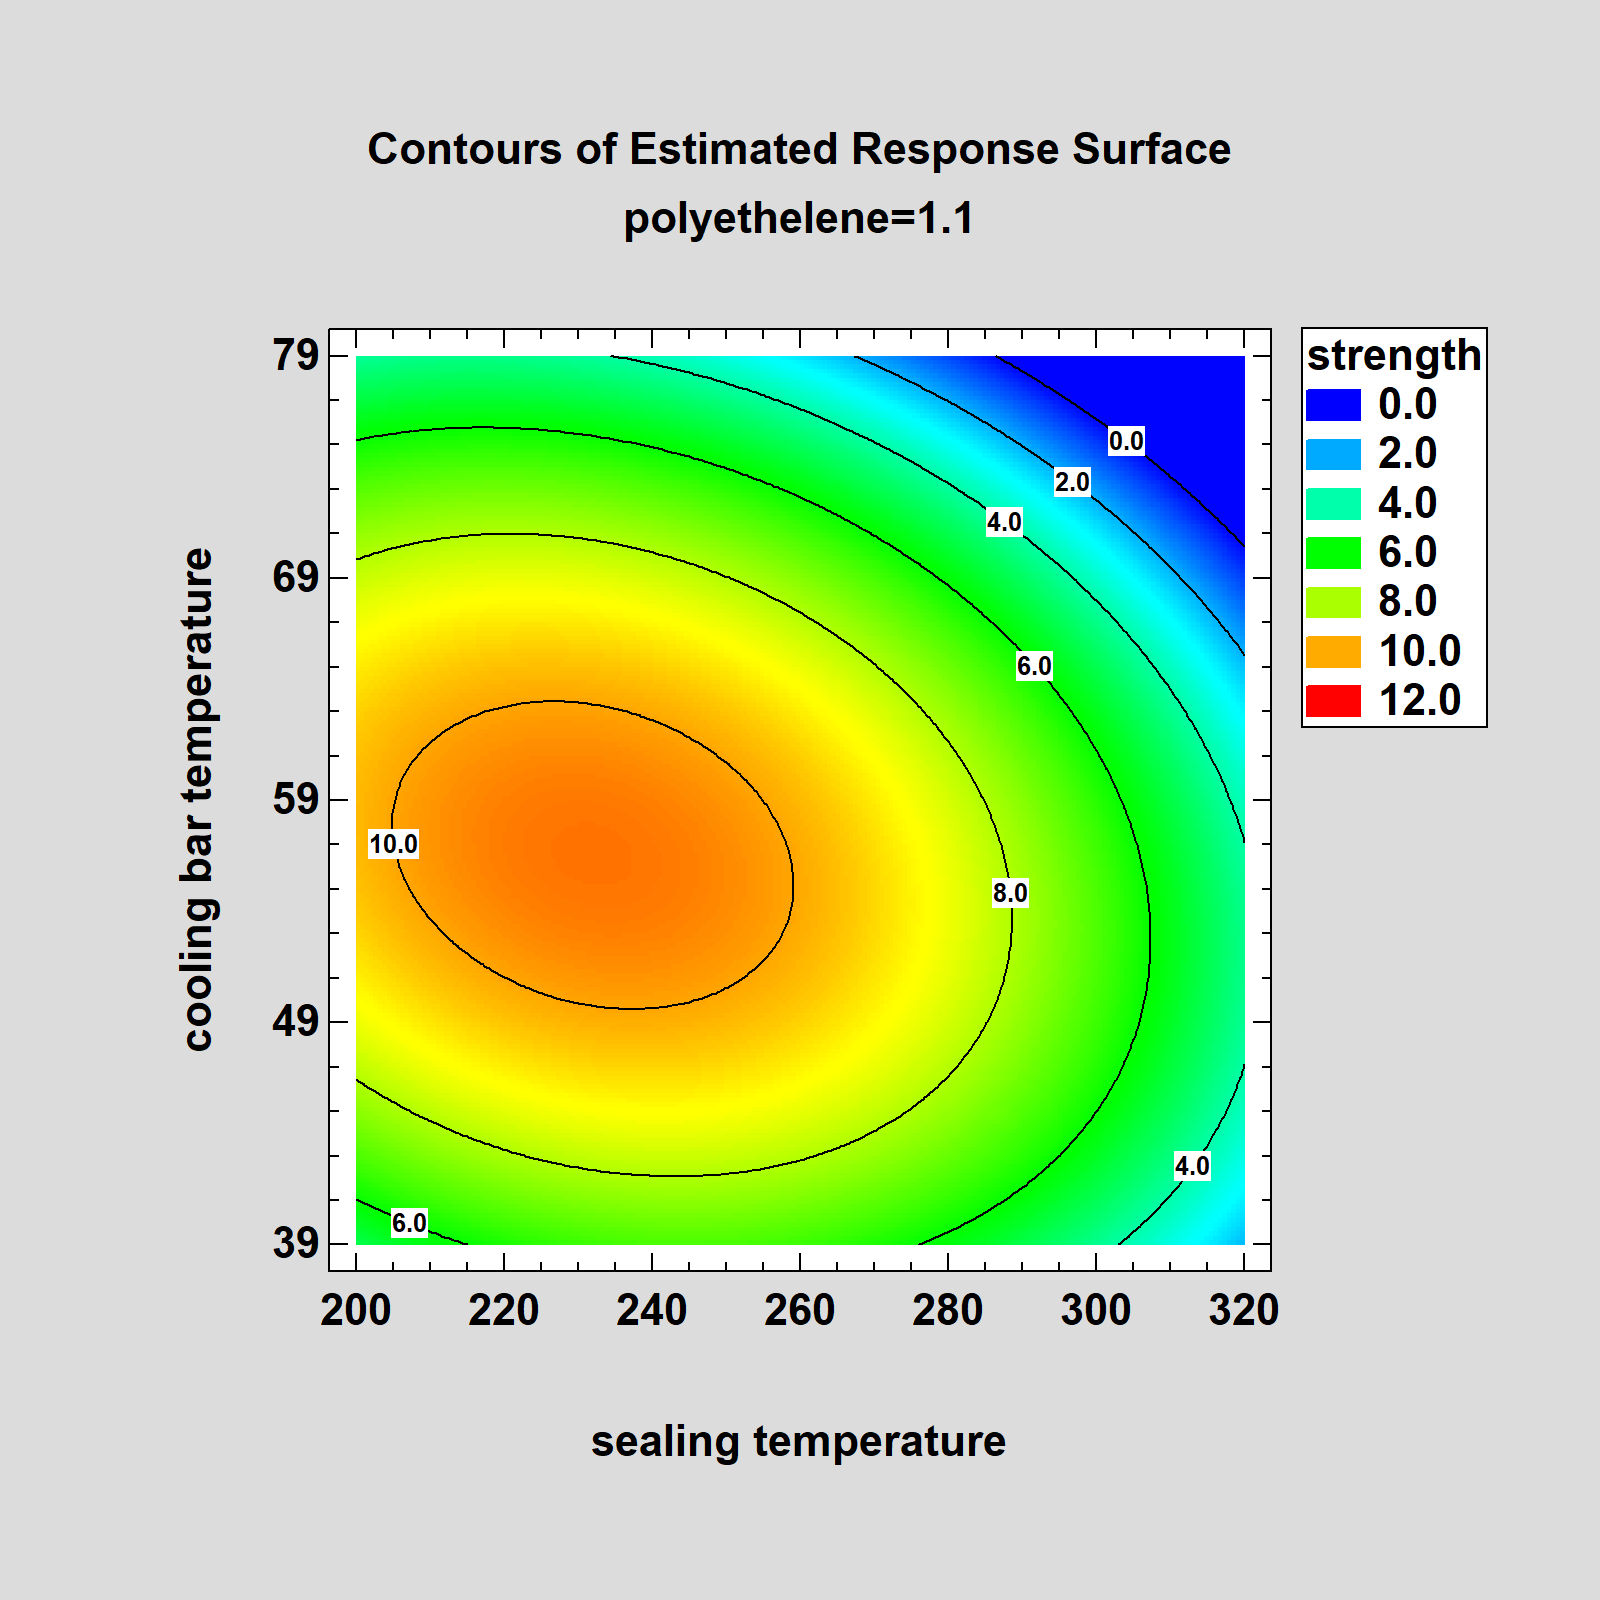
Improved Contour Plots
Contour plots throughout the program now allow contour lines and labels to be added to gradient contour plots. In addition, new settings have been added to control the font and background of the labels.
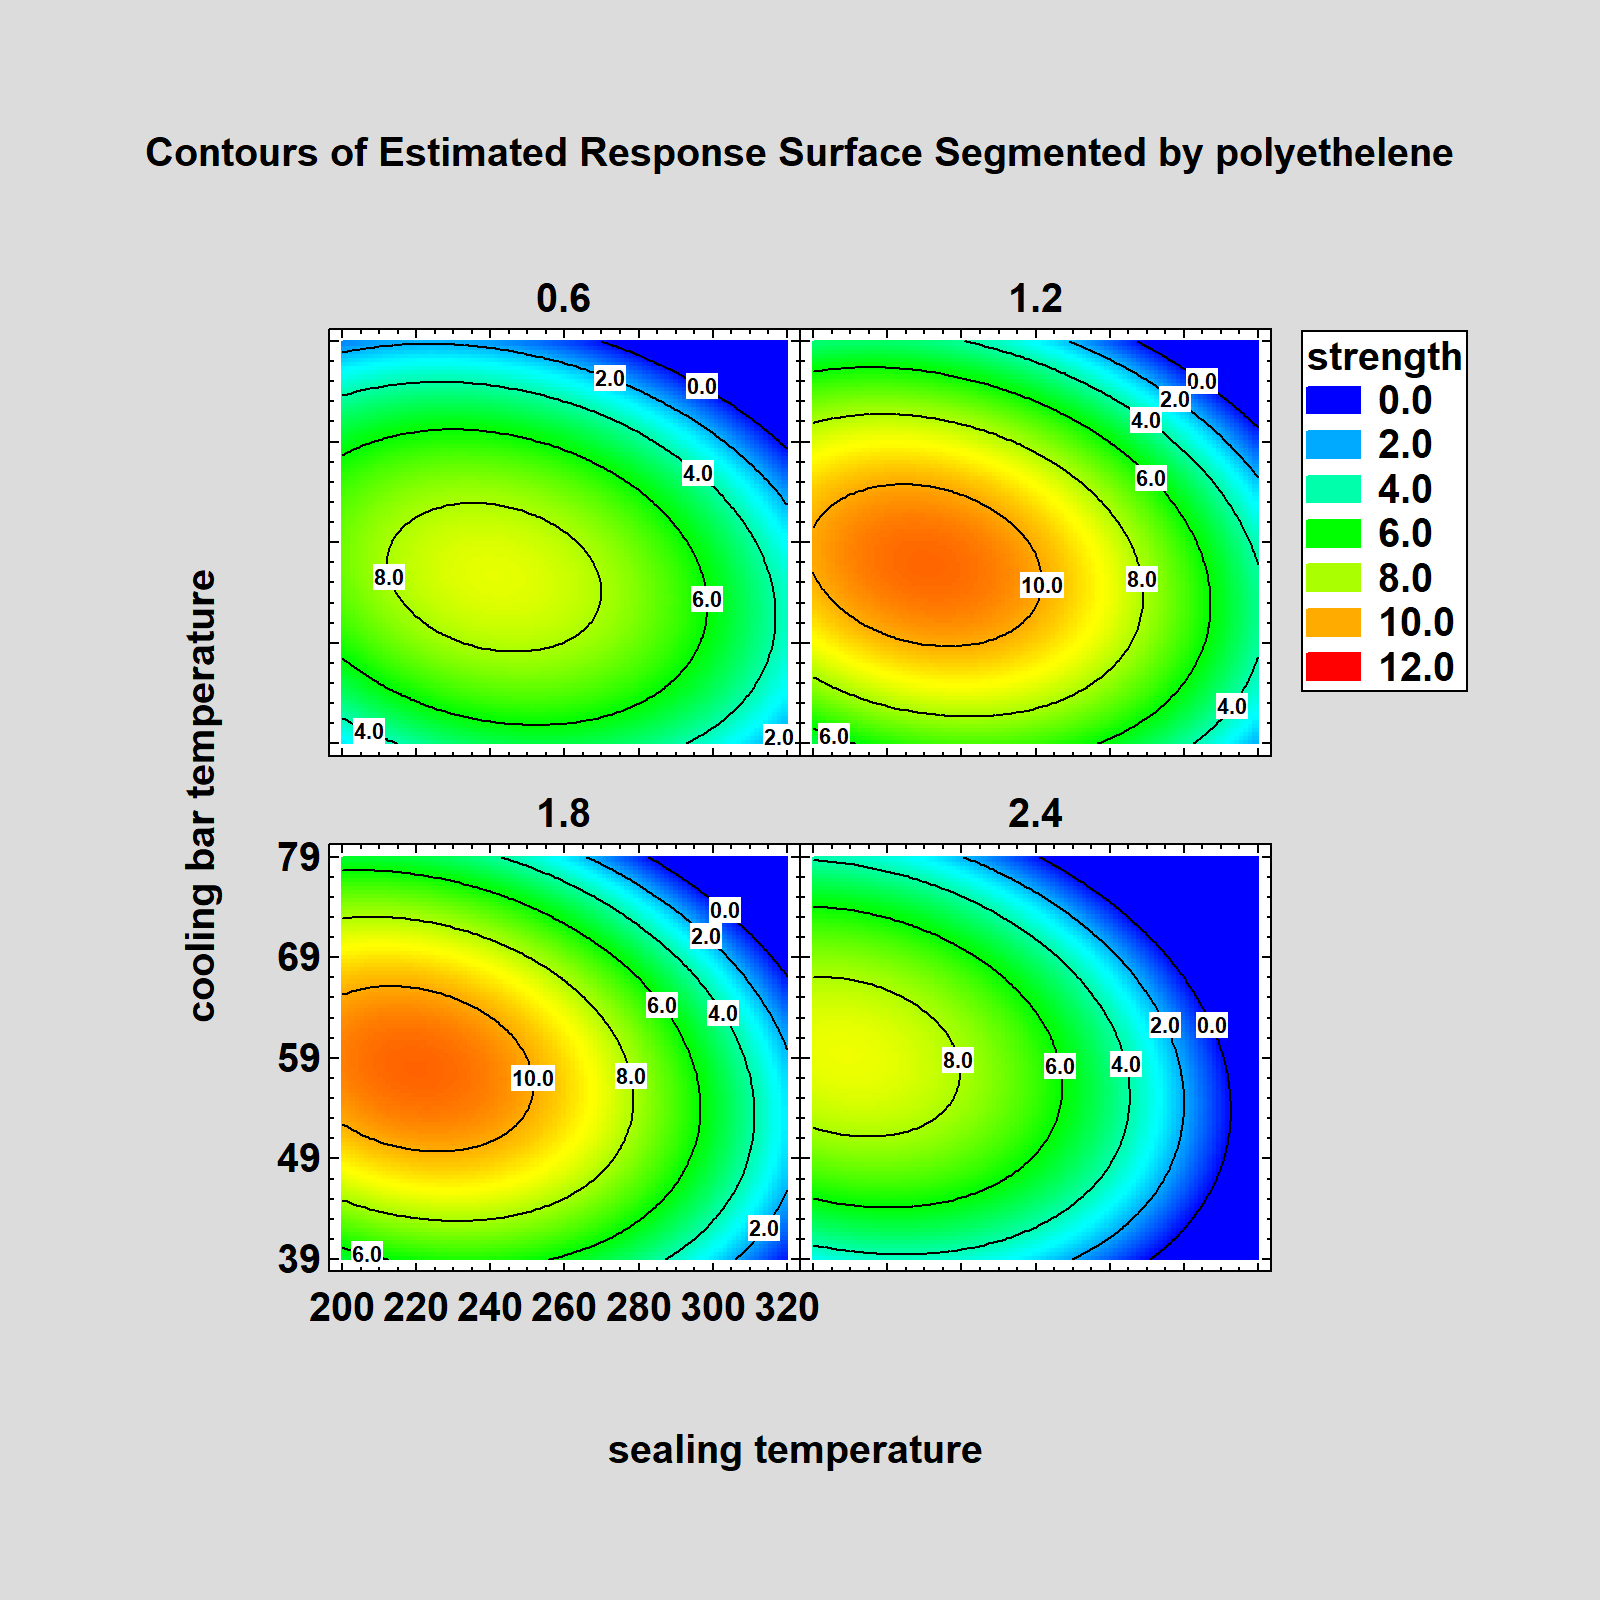
Trellis Plots in DOE Wizard
Trellis plots have been added to the response surface plotting section of the Design of Experiments Wizard. Trellis plots are segmented contour plots that show how the estimated response changes as a function of 3 or 4 factors. 2 continuous factors define the axes, while 1 or 2 other continuous or categorical factors are used to segment the plot.
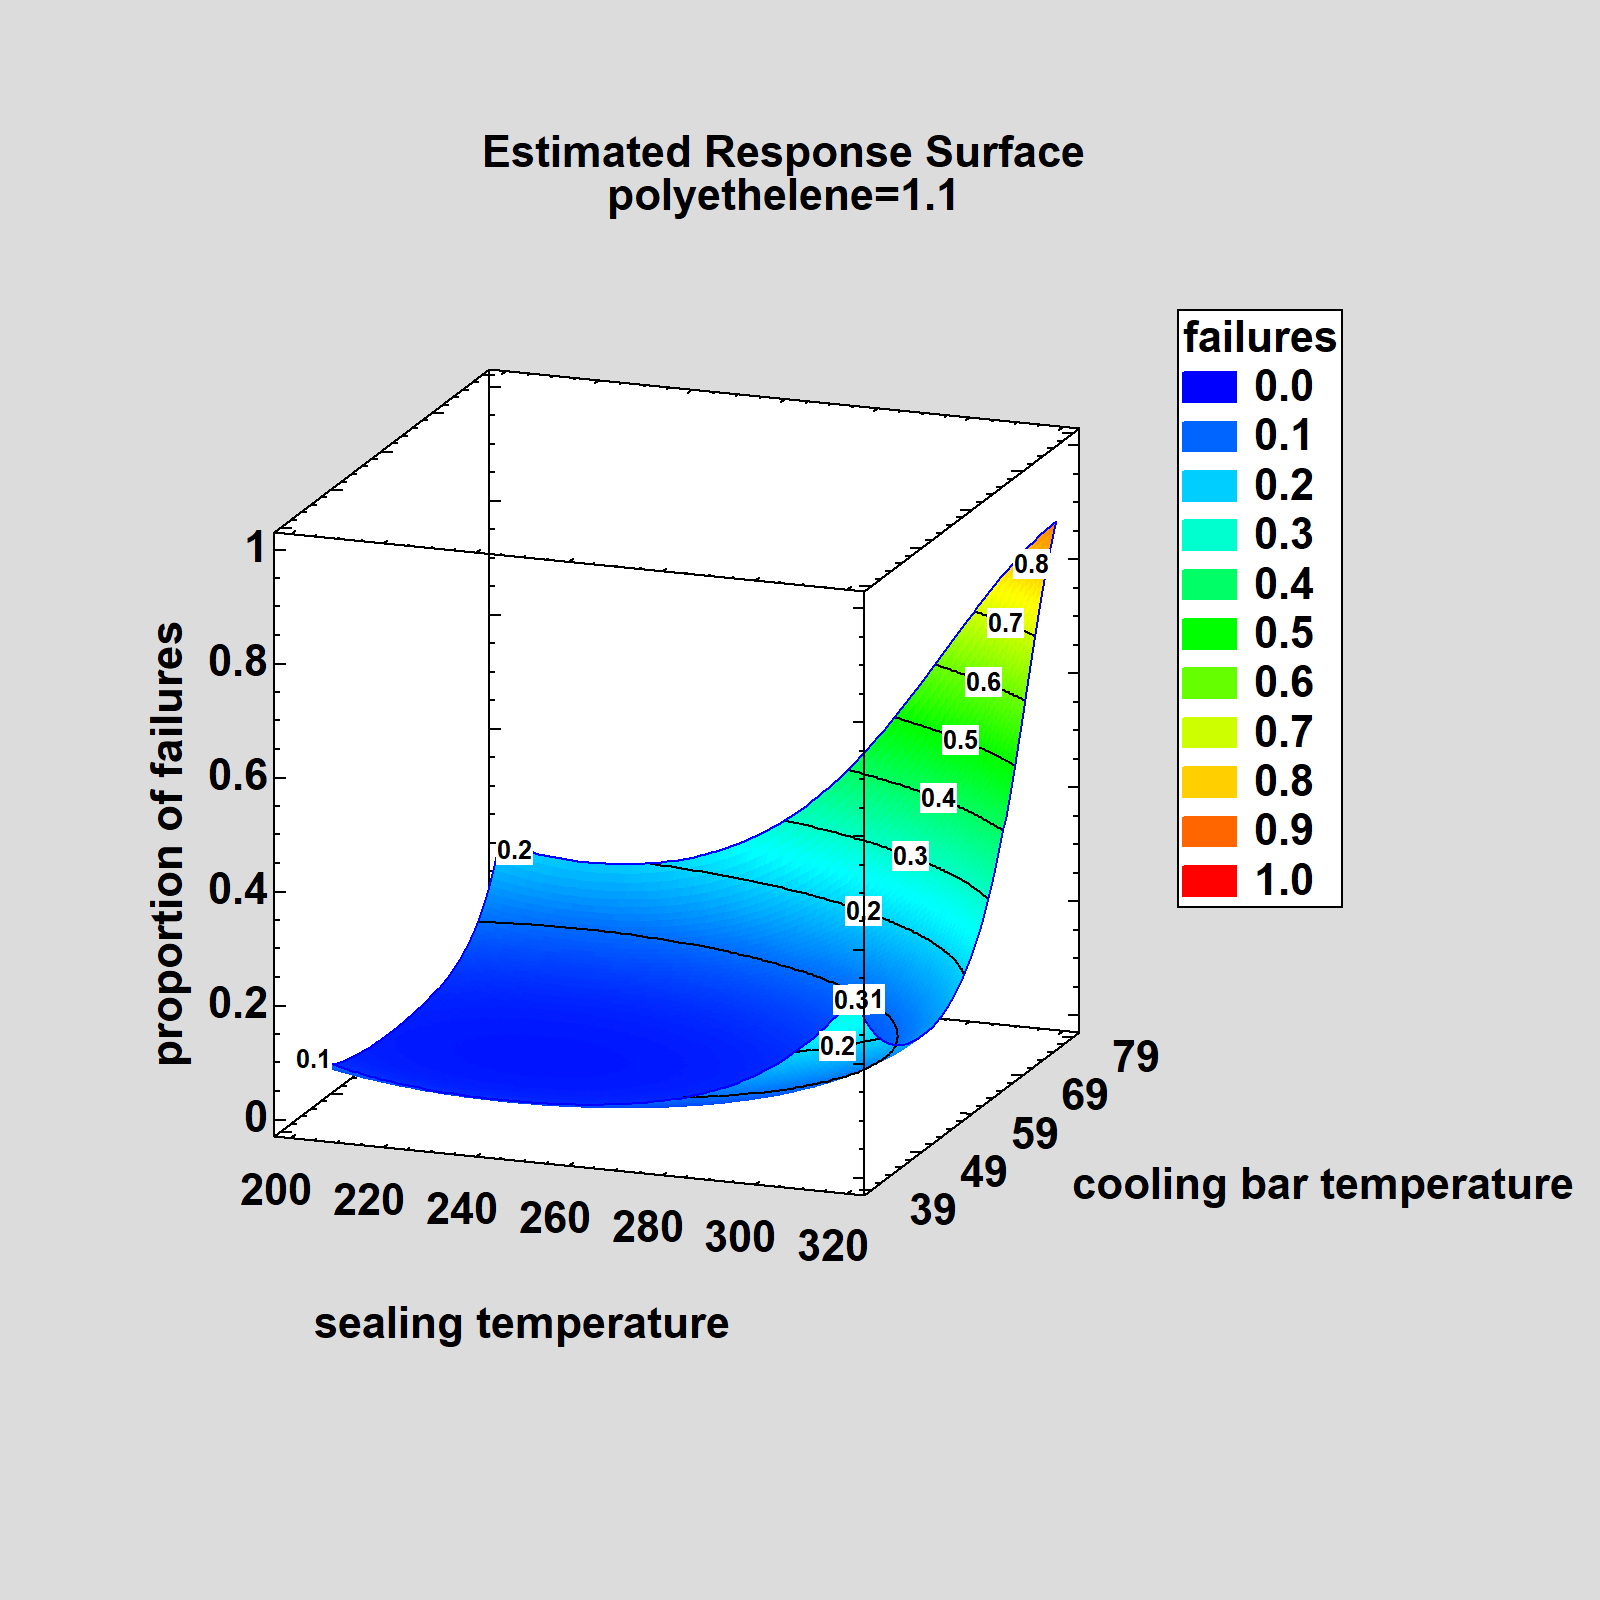
Transformations for Binary Data in DOE Wizard
The logit and probit functions have been added to the transformations available in the DOE wizard. These functions are designed for modeling response data consisting of proportions. They have the effect of constraining all predictions to the [0,1] interval and of stabilizing the variance. In addition, predictions based on all transformations (including logarithms and the Box-Cox transformation) may now be plotted in either the original or transformed units.
New Operators for Reproducing Transformations
Four new operators have been added to Statgraphics expressions to reproduce the transformations used in the DOE Wizard: BOXCOX, INVBOXCOX, LOGIT, INVLOGIT, PROBIT and INVPROBIT.
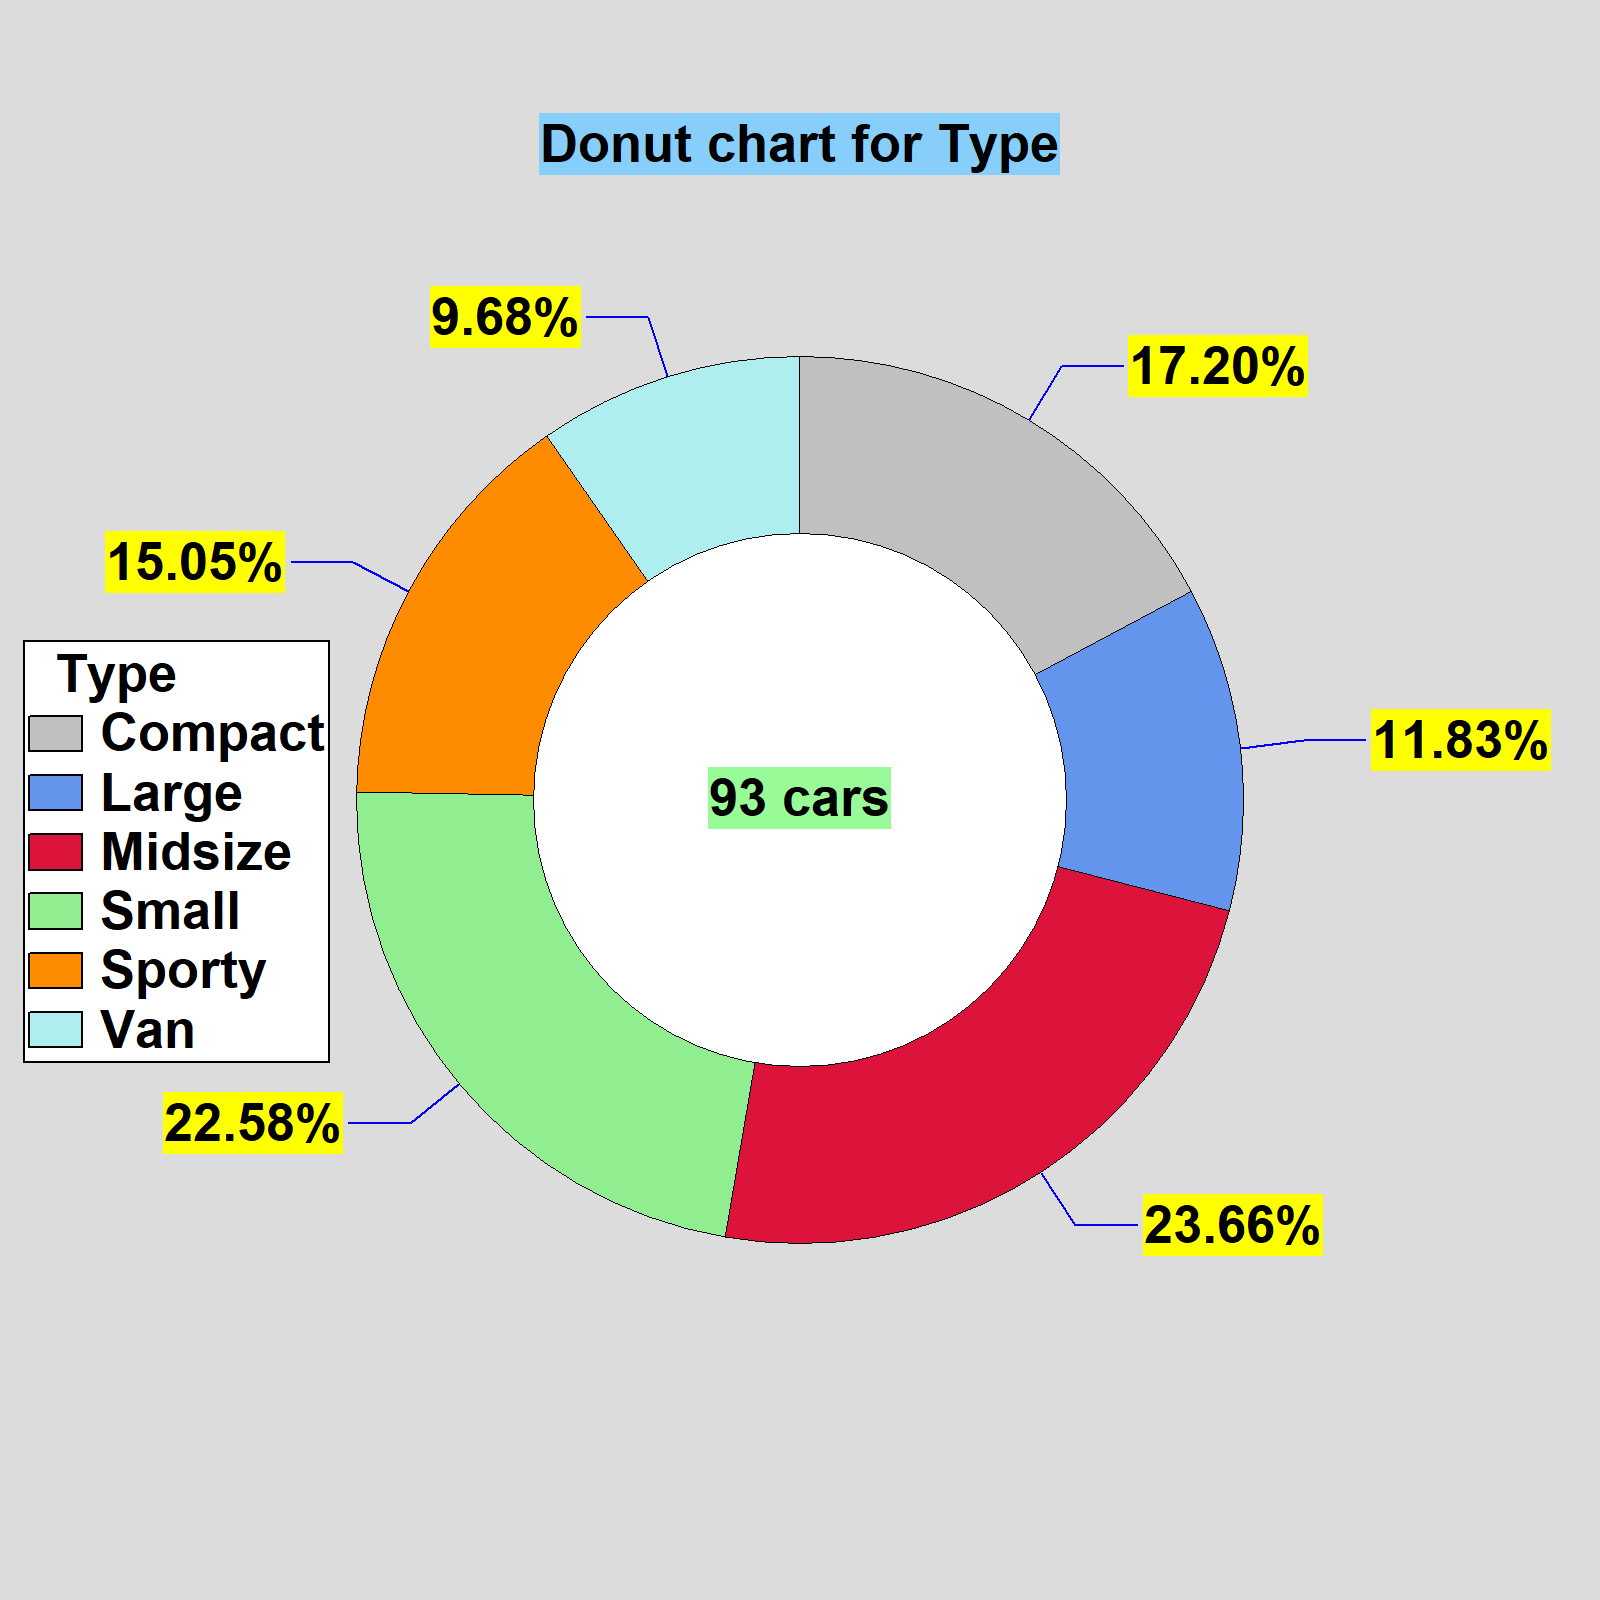
Opaque Graphics Text
Users now have the choice of a transparent or opaque background for all graphics text. If opaque, the color of the background may be specified.

© 2025 Statgraphics Technologies, Inc.
The Plains, Virginia
CONTACT US
Have you purchased Statgraphics Centurion or Sigma Express and need to download your copy?
CLICK HERE


