Statgraphics Centurion 19 - Download the newest version of our flagship product for Windows.
Statgraphics Centurion 18 - Download the previous version of our flagship product for Windows.
Statgraphics Centurion XVII - These links are provided as a courtesy to users of version 17.
Statgraphics Centurion XVI - These links are provided as a courtesy to users of version 16.
Statgraphics Sigma express - Download our add-in for Microsoft Excel 2003, 2007, 2010, 2013, 2016 and 365.
Statgraphics - To use the latest build of Statgraphics Stratus, go to www.statgraphicsstratus.com
During the Evaluation period of Statgraphics 19, you may switch between languages by selecting Edit - Preferences from the main STATGRAPHICS Centurion menu. Click on the Language tab and select the language you wish to use. You may select different languages for the user interface and for the output. Once the evaluation period is over, the languages you have access to will depend on the license that you purchase. Access to more than one language requires that you purchase a license for either the Bilingual Edition or the Multilingual Edition.
Two new procedures have been added:
Significant improvements have also been made to several procedures throughout the program. These include:
One Variable Analysis and One Sample Analysis SnapStat
The data input dialog box for these procedures has been expanded to allow for the input of data based on values and frequencies. For example, consider the data below showing how many tries were necessary to guess the word presented by the New York Times Wordle puzzle for a sample of 300 games:
| Tries | Games |
| 1 | 0 |
| 2 | 5 |
| 3 | 43 |
| 4 | 125 |
| 5 | 93 |
| 6 | 32 |
| 7 | 2 |
To calculate statistics such as the average number of tries, the data input dialog box can be completed as follows:
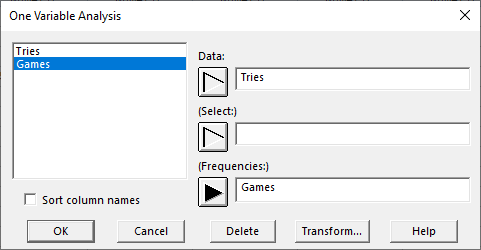
This permits a more intuitive analysis than having to enter REP(Tries,Games) in the Data field as well as improving the labeling in tables and graphs.
Oneway ANOVA, Multiple Sample Comparison, Multifactor ANOVA and General Linear Models
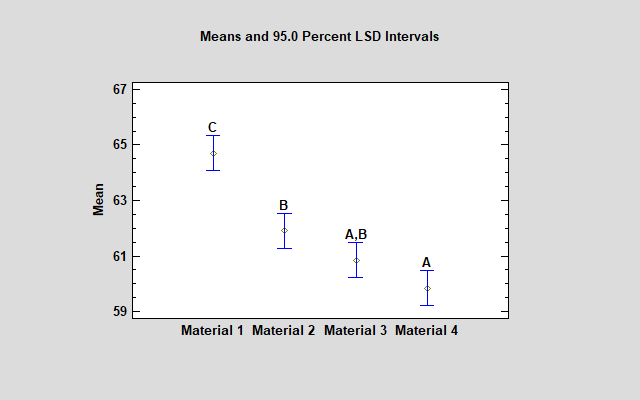
The table generated by the Multiple Range Analysis now creates columns of letters rather than X's to indicate members of each homogenous group:

The letters may also be added to the Means Plot to signify the homogenous groups into which the level means have been grouped. For example, the plot below shows that materials 1, 2 and 4 all belong to different groups. No conclusion has been reached about material 3, which may below to either group A or group B.
Barchart, Multiple Barchart, Tabulation, Crosstabulation, Pareto Analysis
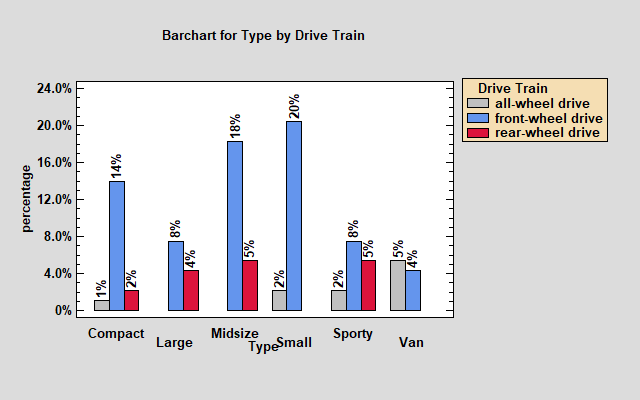
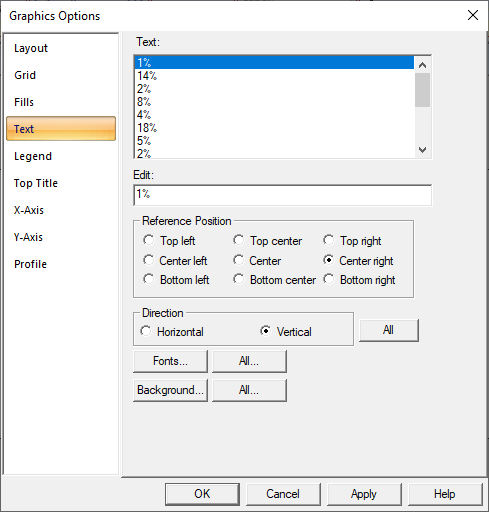
Barcharts created by several procedures now allow labels to be oriented in a vertical direction, as in the plot below:

© 2025 Statgraphics Technologies, Inc.
The Plains, Virginia
CONTACT US
Have you purchased Statgraphics Centurion or Sigma Express and need to download your copy?
CLICK HERE