

Published under: Data analytics, Forcasting, Regression, Statgraphics 18
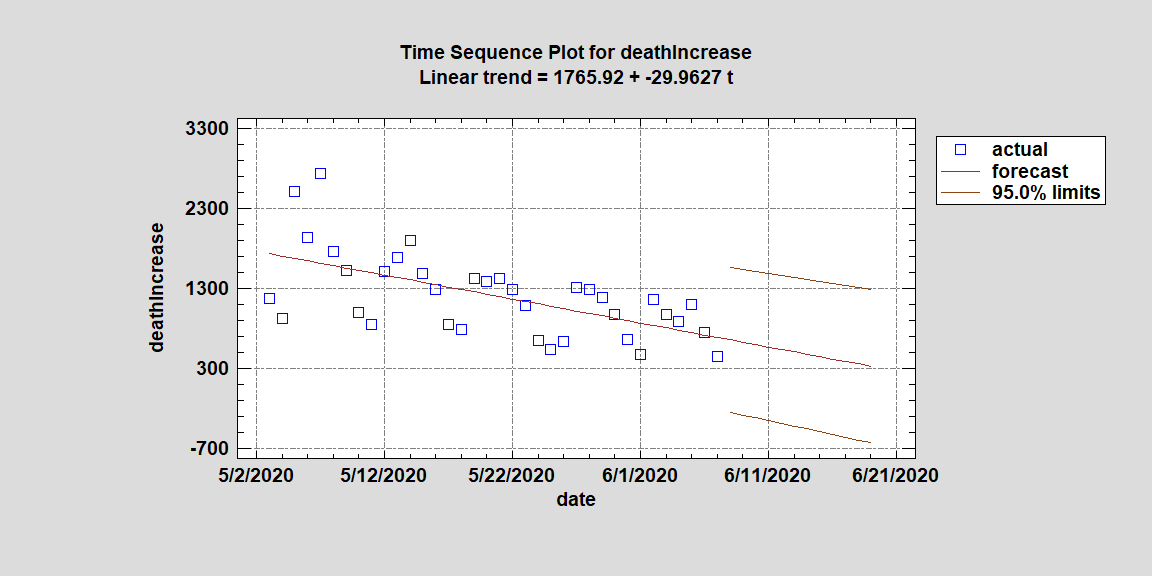
The Statgraphics Team reviewed the daily reported deaths in the USA due to COVID-19 according to the public data collected at the state and national level (https://covidtracking.com/api) and noticed there might be a downward trend forming. We originally looked at all the historic data for the USA but many of our forecasting models did not find a downward trend forming. This may be because a majority of the models were picking up a trend that fluctuated both up and down. So instead of looking at the data from the beginning of the outbreak, we looked at the last few weeks where there appeared to be a downward trend: data after May 3rd. One of the better forecasting models we reviewed was a simple linear trend. Originally, the linear trend had a negative slope for both the forecast and confidence limits. It forecast a rate of decrease in daily deaths by appropriately 30 people per day (see Time Sequence Plot 1). Using this model, we could forecast that in two weeks the daily death total of the entire country would only be around 330 people per day (see Table 1). However when we looked at the lower 95% confidence limit, we noticed that the daily death number turned negative.
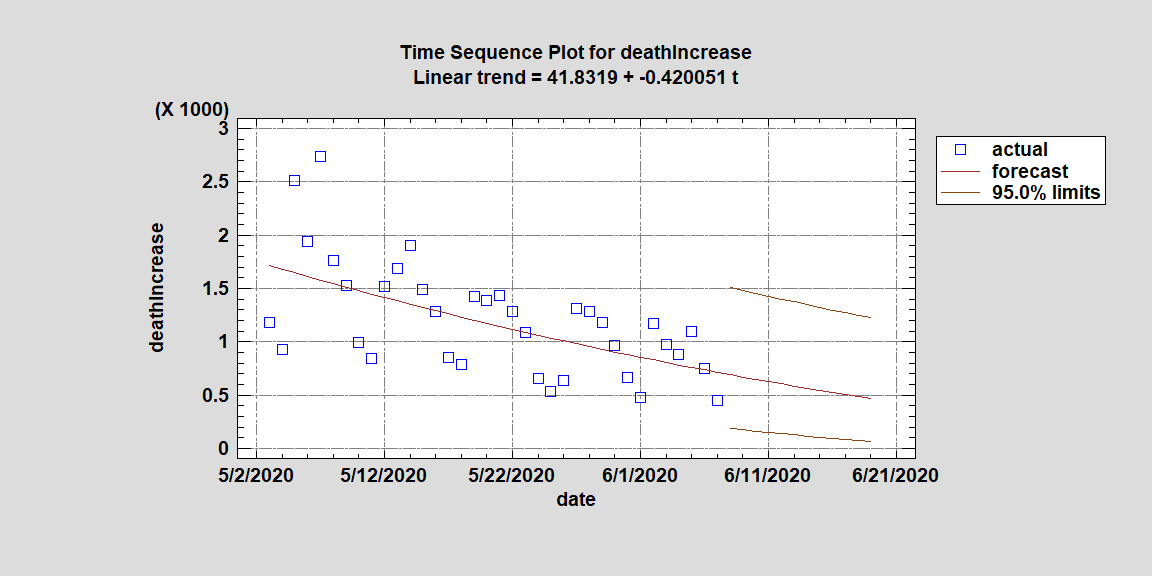
A proper forecasting model cannot project negative deaths and knowing that generally things tend to go more proportionally to zero than linearly, we decided to square root the data hoping it would create a model with a lower confidence limit that stayed positive. If you look at Time Sequence Plot 2, you will see that the lower 95% confidence limit does in fact stay positive and bends in the beginning then straightening out near zero. This shows a more realistic projection while still showing a downward trend. In both tables and plots, the upper confidence limit remains well over a 1000 people a day. However if the trend is not affected by mass gatherings, the reopening of the economy, and people who simply stop following proper health practices (such as washing your hands), we may see the daily death total for the entire country go below 500 in two weeks.
Finally, we went back to review several forecasting models using the historical data starting when the the first positive test was reported in the USA. If we look at a forecasting model using Brown's linear exponential smoothing for all the data transformed by their square roots, we find a similar downward trend forming and a forecast of the daily death total to also go below 500 in two weeks just like we did when we only looked at data since May 3rd (see Time Sequence Plot 3). The upper limit of this model rises in an apparent exponential fashion forecasting the amount of COVID-19 deaths in the United States of America could still in fact increase based on the historical data.
Time Sequence Plot 1: A Forecasting Model for the Daily Number of Deaths in the USA from COVID-19 using the Raw Data
Time Sequence Plot 2: A Forecasting Model for the Daily Number of Deaths in the USA from COVID-19 using the Square Root of each Daily Death Total to Create the Model
Time Sequence Plot 3: A Forecasting Model for the Daily Number of Deaths in the USA from COVID-19 using the Square Root of each Daily Death Total from the 1st Positive Test to Create a Model
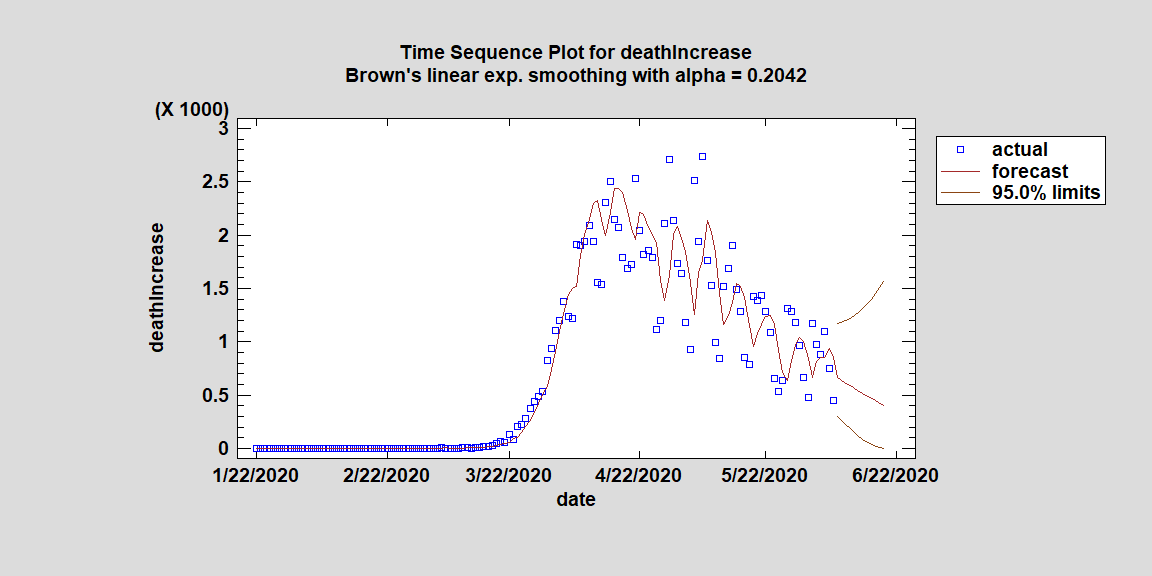
Table 1: Forecast of the Linear Trend with Raw Data for the Next Two Weeks
|
|
|
Lower 95% |
Upper 95% |
|
Period |
Forecast |
Limit |
Limit |
|
6/8/2020 |
657.302 |
-247.98 |
1562.58 |
|
6/9/2020 |
627.339 |
-281.902 |
1536.58 |
|
6/10/2020 |
597.376 |
-316.013 |
1510.77 |
|
6/11/2020 |
567.414 |
-350.312 |
1485.14 |
|
6/12/2020 |
537.451 |
-384.795 |
1459.7 |
|
6/13/2020 |
507.488 |
-419.46 |
1434.44 |
|
6/14/2020 |
477.526 |
-454.305 |
1409.36 |
|
6/15/2020 |
447.563 |
-489.326 |
1384.45 |
|
6/16/2020 |
417.6 |
-524.52 |
1359.72 |
|
6/17/2020 |
387.637 |
-559.885 |
1335.16 |
|
6/18/2020 |
357.675 |
-595.418 |
1310.77 |
|
6/19/2020 |
327.712 |
-631.115 |
1286.54 |
Table 2: Forecast of the Linear Trend with the Square Root Transformed Data for the Next Two Weeks
|
|
|
Lower 95% |
Upper 95% |
|
Period |
Forecast |
Limit |
Limit |
|
6/8/2020 |
691.164 |
188.01 |
1510.75 |
|
6/9/2020 |
669.254 |
175.208 |
1482.5 |
|
6/10/2020 |
647.697 |
162.79 |
1454.73 |
|
6/11/2020 |
626.493 |
150.764 |
1427.41 |
|
6/12/2020 |
605.642 |
139.14 |
1400.54 |
|
6/13/2020 |
585.143 |
127.924 |
1374.12 |
|
6/14/2020 |
564.998 |
117.126 |
1348.13 |
|
6/15/2020 |
545.206 |
106.753 |
1322.57 |
|
6/16/2020 |
525.766 |
96.8139 |
1297.42 |
|
6/17/2020 |
506.679 |
87.3158 |
1272.69 |
|
6/18/2020 |
487.945 |
78.2668 |
1248.36 |
|
6/19/2020 |
469.564 |
69.6744 |
1224.42 |
Table 3: Forecast of Brown's Linear Exp. Smoothing with the Historic Square Root Transformed Data for the Next Two Weeks
|
|
|
Lower 95% |
Upper 95% |
|
Period |
Forecast |
Limit |
Limit |
|
6/8/2020 |
664.662 |
301.574 |
1169.38 |
|
6/9/2020 |
638.132 |
261.514 |
1180.0 |
|
6/10/2020 |
612.142 |
221.833 |
1196.4 |
|
6/11/2020 |
586.693 |
183.332 |
1218.25 |
|
6/12/2020 |
561.784 |
146.777 |
1245.3 |
|
6/13/2020 |
537.416 |
112.891 |
1277.31 |
|
6/14/2020 |
513.587 |
82.3471 |
1314.09 |
|
6/15/2020 |
490.299 |
55.7711 |
1355.52 |
|
6/16/2020 |
467.552 |
33.7469 |
1401.51 |
|
6/17/2020 |
445.344 |
16.8216 |
1451.99 |
|
6/18/2020 |
423.677 |
5.51043 |
1506.95 |
|
6/19/2020 |
402.551 |
0.302197 |
1566.39 |


