

 By:
By: Published under: data visualization, statistical analysis, data analysis, Cloud Analytics, Cloud Computing, machine learning
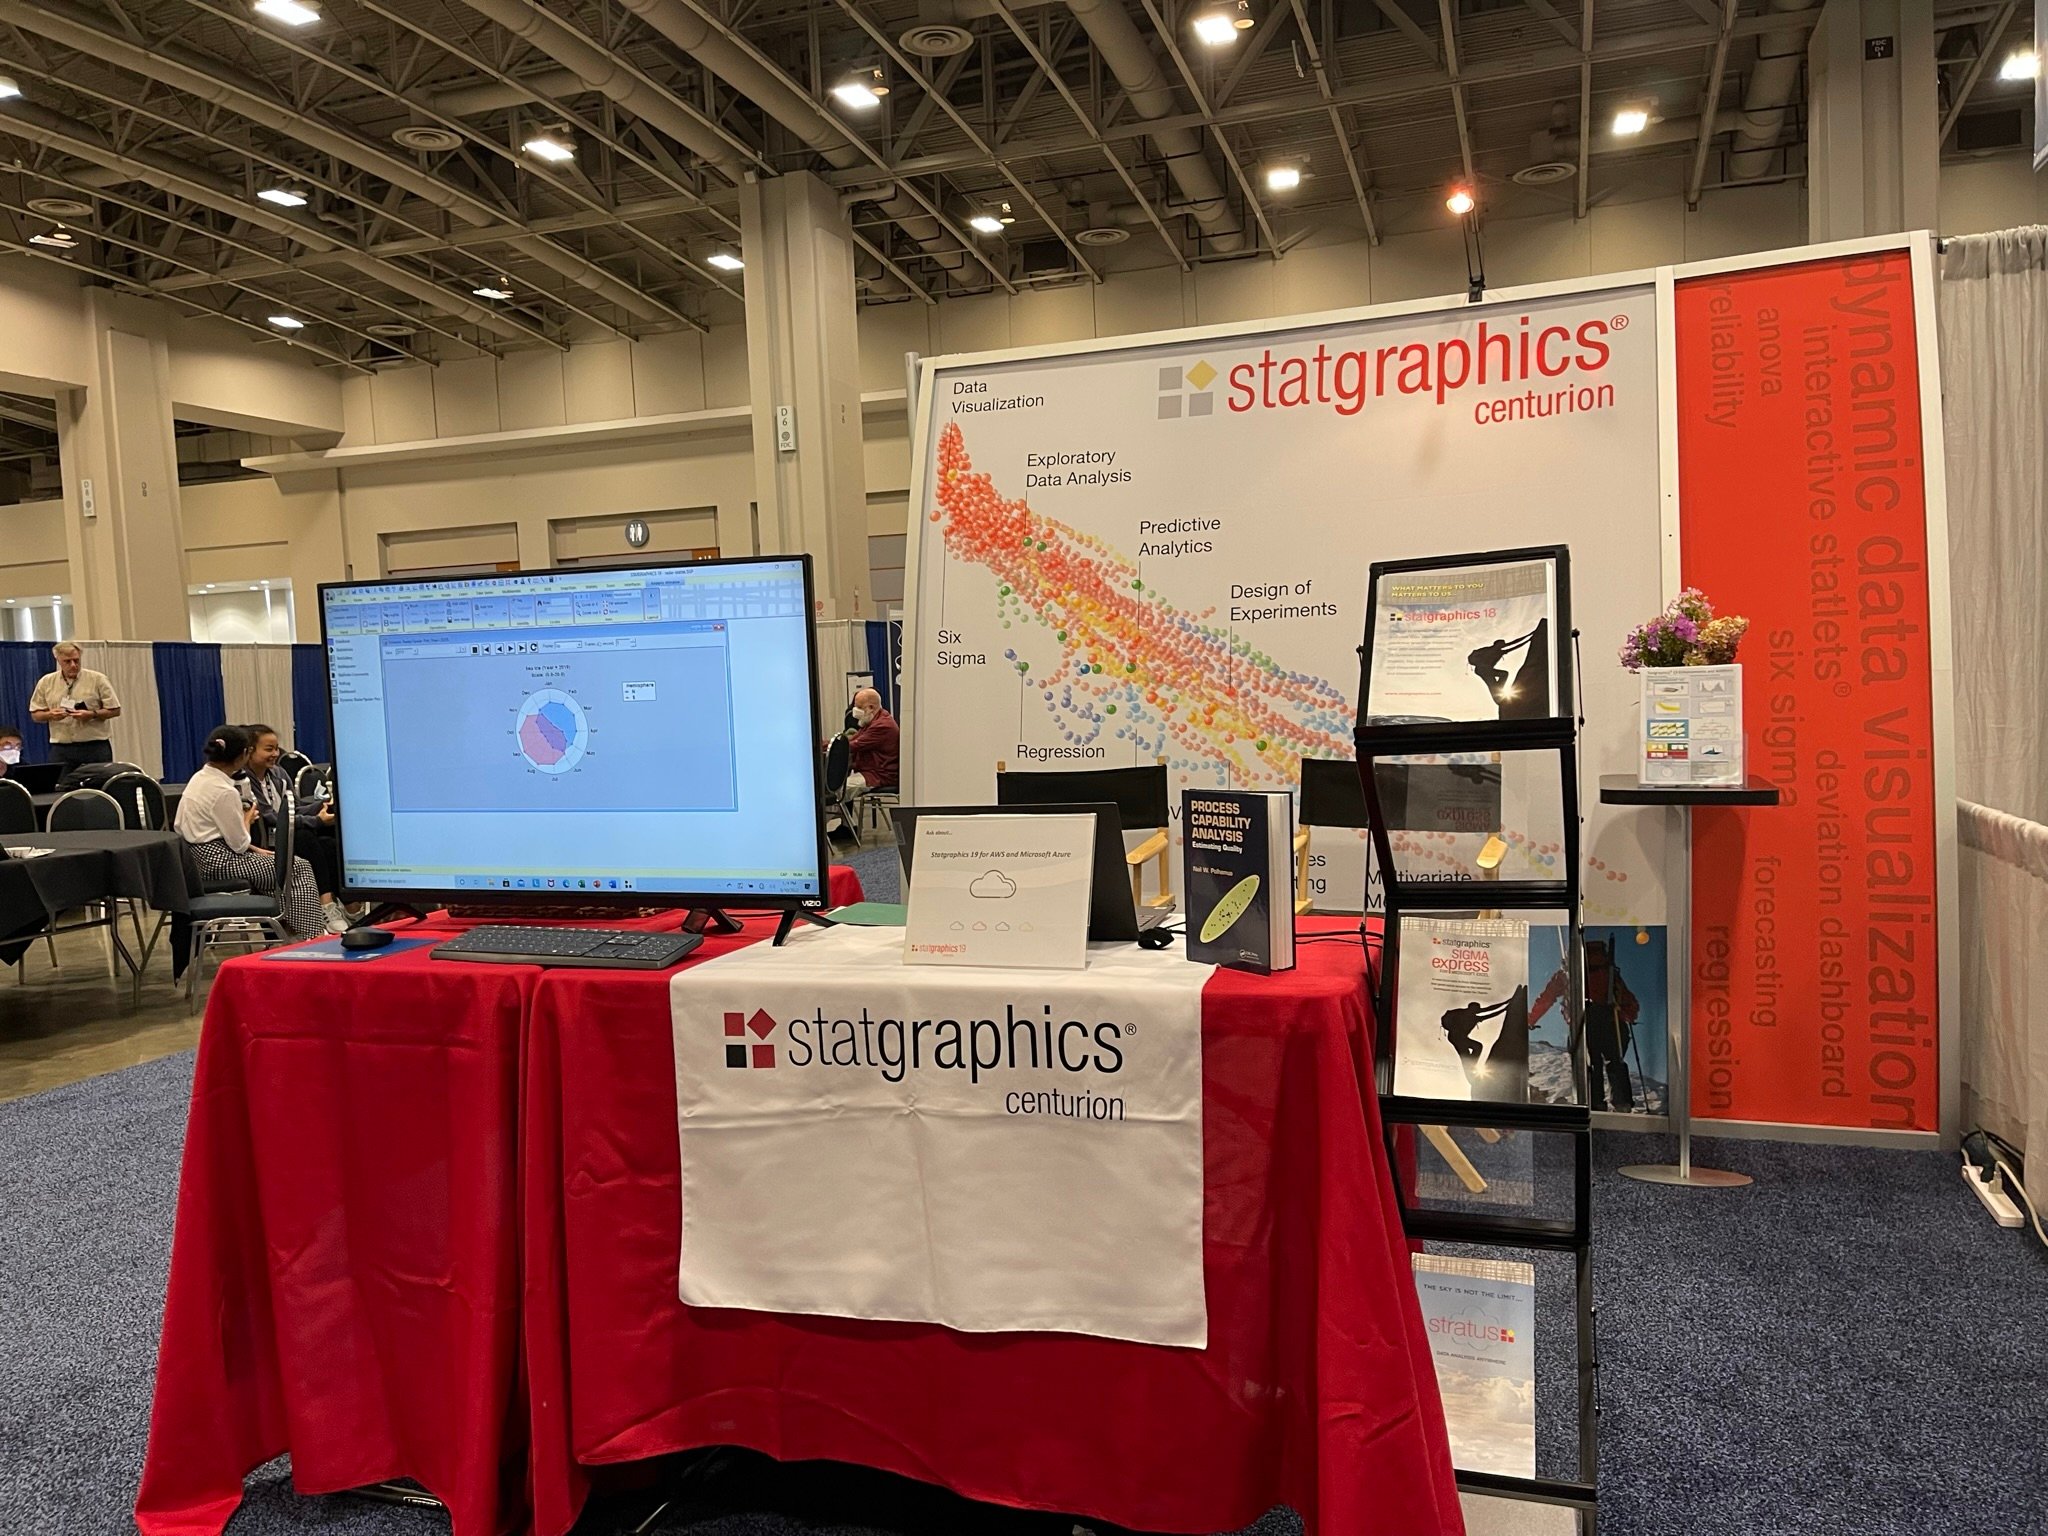
For the first time since August of 2019, the Joint Statistical Meetings (JSM) were held in person rather than virtually. JSM is organized by the American Statistical Association and is the largest gathering of statisticians in North America. This year, it was held at the Washington D.C. Convention Center. Statgraphics Technologies joined with other software vendors and book publishers in demonstrating their products to attendees from industry, government and academia.
 Representatives from Statgraphics Technologies demonstrated many of the new features added to Statgraphics 19. Most popular among the attendees were:
- The animated display of COVID-19 cases and deaths around the world, visualized using a dynamic Pareto chart.
- Changes in the amount of sea ice in the northern and southern hemisphere, visualized using a dynamic radar plot (shown on the monitor in the above picture).
- Growth of the US population beginning in 1950, visualized using a dynamic population pyramid.
- Evolution of world demographics, visualized using a dynamic 2-D bubble chart.
- The interfaces to R and Python, used to display a word cloud and clusters created by the new K-means procedure.
- Access to Statgraphics via the Internet, using the new versions for AWS and Microsoft Azure.
If you would like a copy of the handouts given to attendees, click on the links below:
Version 19 Additions and Enhancements
Statgraphics for AWS and Microsoft Azure


