

 By:
By: Published under: statistical analysis, data analysis, Python interface
While developing Statgraphics, we have included many options, not always envisioning how useful some of them would be. One has to do with the ability to differentiate between columns with identical column names that appear in more than one datasheet. In this blog, I'll show you an example involving the Statgraphics-Python interface, where Python is used to manipulate Statgraphics data.
Recently, a client wanted to do the following:- Read data into Statgraphics from a database.
- Pass the data to Python to do some preliminary filtering.
- Return the filtered data to Statgraphics in order to create various SPC charts.
- Save the sequence of operations in a StatFolio so that it could be rerun whenever the data in the database changed.
Steps 1-3 worked as expected. However, once the StatFolio was saved and reloaded, the process failed.
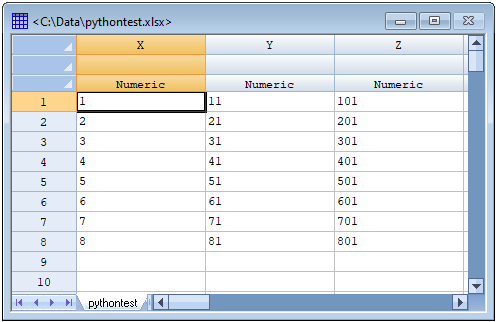
To reproduce the problem, I created a simple Excel spreadsheet with 3 columns named X, Y, and Z. I then read the data into Statgraphics using File - Open - Open Data Source - External Data File. It created the datasheet shown below:
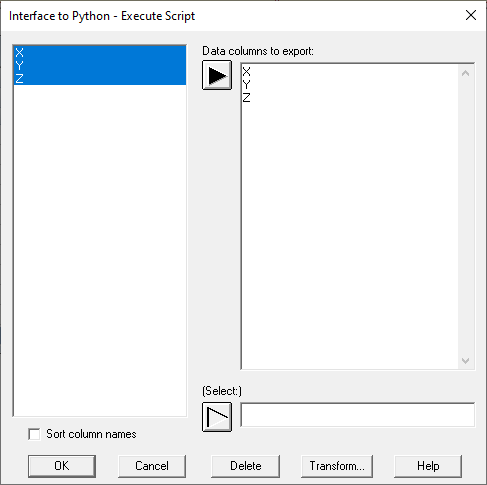
I then selected Interfaces - Python - Execute Script and specified 3 columns to send to Python:
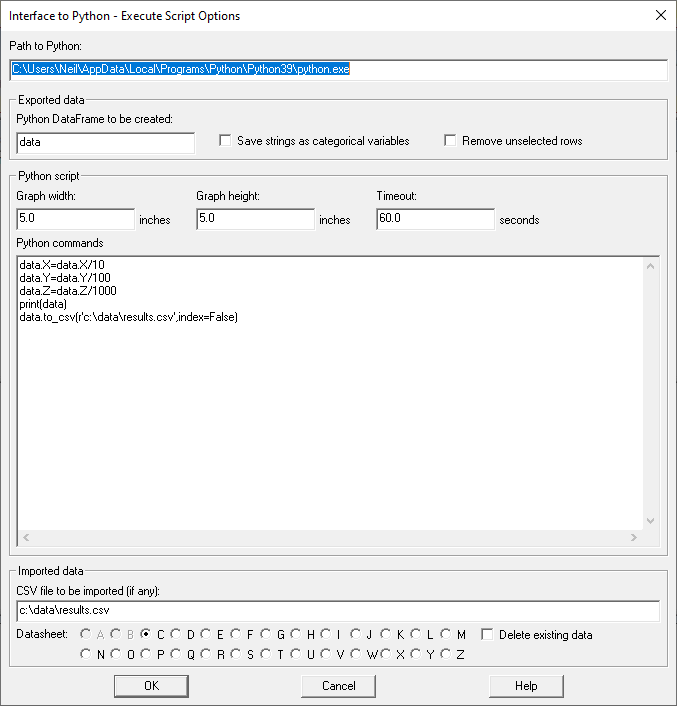
In my script, I told Python to do some divisions, print the results and return the modified data to Statgraphics:
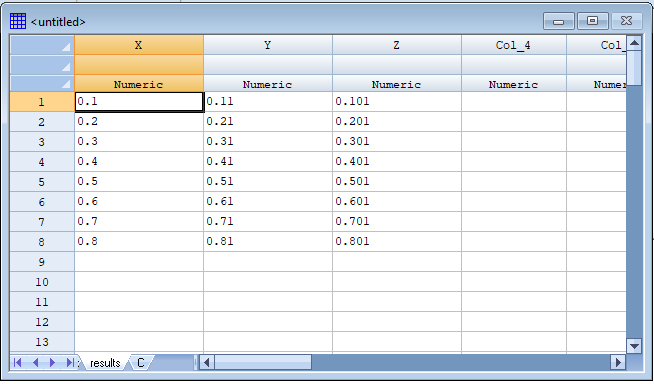
As expected, the data were returned and placed in a second datasheet:
I then saved the StatFolio and tried to rerun it, but it failed. The first error message I saw was:
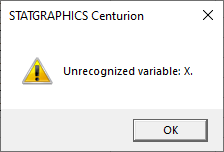
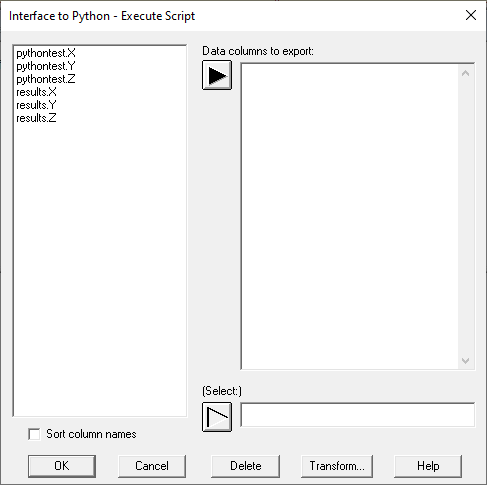
What went wrong? The problem is that once the script was run for the first time, "X" was ambiguous since there were now 2 datasheets with a column named "X". In fact, the data input dialog box for executing a Python script now looked as follows:
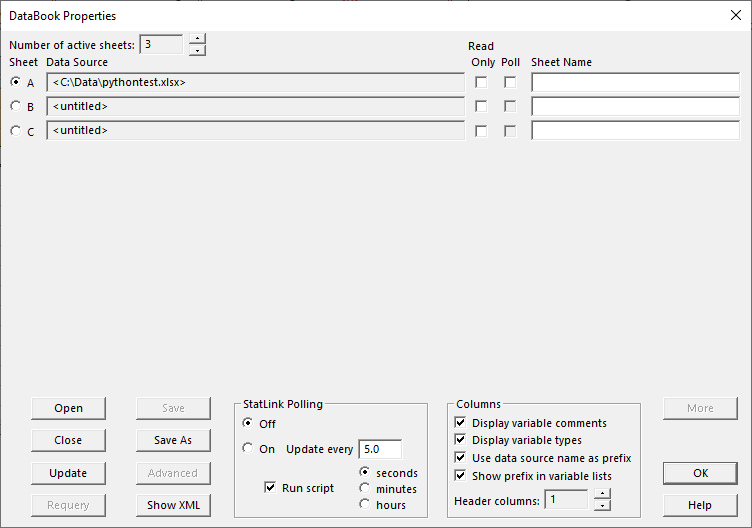
To fix the problem, I realized that before I ran the script for the first time, I should have told the program to always append the sheet name to column names on data input dialog boxes, even when there's only 1 datasheet. This is done by going to the main menu and selecting Home - Properties - Databook. In the bottom right is an option labeled Show prefix in variable lists:
If that is checked, then the original data input dialog box when creating a script looks like:
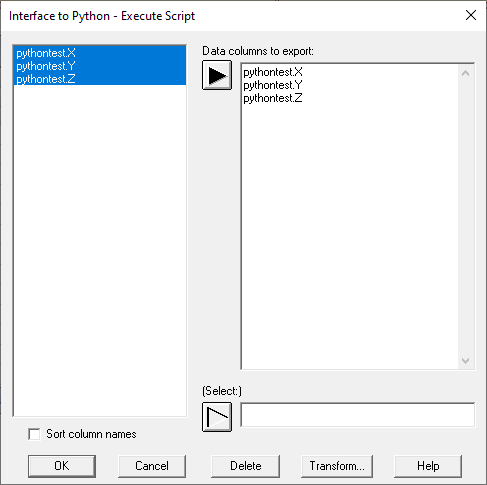
This eliminates any later confusion after the second datasheet has been created.
One other important option. When specifying the Python script, I also need to check the Delete existing data checkbox.
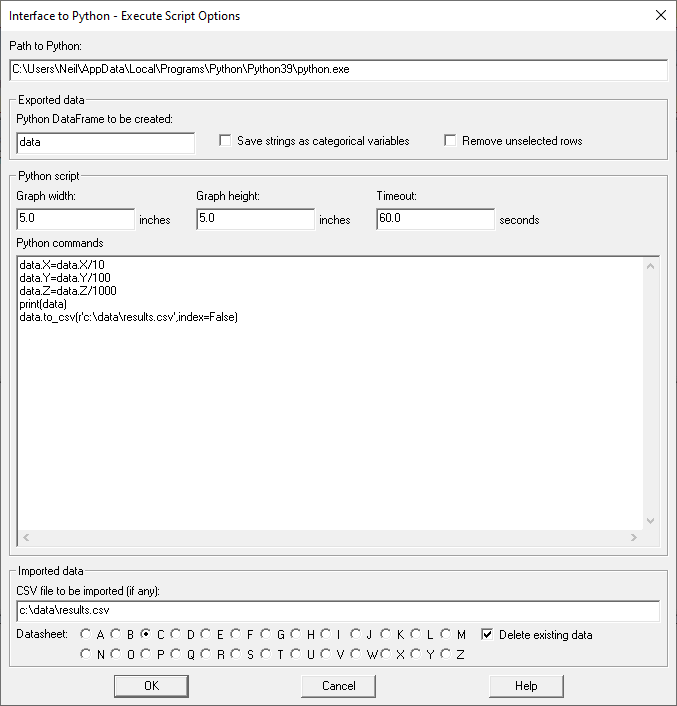
Otherwise, it won't overwrite the data from the previous run.
I now know why we built in those options. Or maybe we just got lucky.
NOTE: To run the example as shown above, download and install Statgraphics version 19.4 or later. When exporting data to R and Python in those versions, datasheet names are not included, making manipulation of data simpler.


