

 By:
By: Published under: new feature, statistical analysis, data analysis, Data analytics, Statgraphics, text mining, analytics software, data mining, wordcloud
Data analysts like myself who have been trained as natural scientists and engineers tend to think of data solely as numbers. On the other hand, social scientists know that much information can also be extracted from textual data. Visualization of text using devices such as wordclouds can be very informative, particularly when more than one set of text are compared. The new Statgraphics 18 interface to R provides access to the "tm" text mining package, which opens up new avenues for extracting information from text.
State of the Union - Trump
On January 30, 2018 President Donald Trump presented his first State of the Union message to Congress. The United States Constitution requires every president on a regular basis to "give to the Congress Information of the State of the Union, and recommend to their Consideration such measures as he shall judge necessary and expedient." The speech gives the President a chance to present his views and priorities to the nation, and much may be learned by examining the text of that speech.
A very important tool for visualizing the content of a text document is the "wordcloud". A wordcloud displays the most commonly used words in a document, usually omitting words such as "a", "the" and "is". I used the Statgraphics 18 Text Mining procedure to analyze the text of Trump's speech (it contains 5,190 words) and produced the following wordcloud:
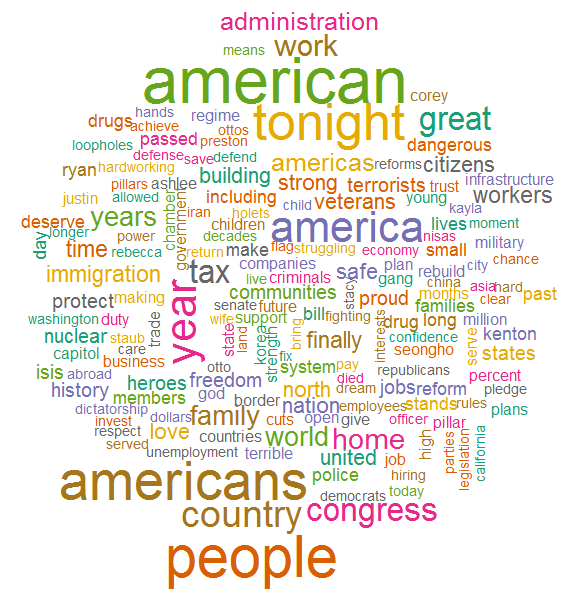
The size of each word is proportional to the number of times that the word appeared in the speech. Words occurring less than 3 times are not included. Not surprisingly, variations of the word "America" appear most frequently. Trump also talked a lot about "tax" and making America "great", "safe" and "strong" again. You can also see that he talked a lot about immigration, drugs, terrorists, and work. The terms "family", "home" and "world" were also used frequently.
State of the Union - Obama
I also went back and did the same analysis of President Barack Obama's first State of the Union message that he gave in January, 2000. It contains 7,091 words. A wordcloud of all non-trivial words appearing at least 3 times is shown below:
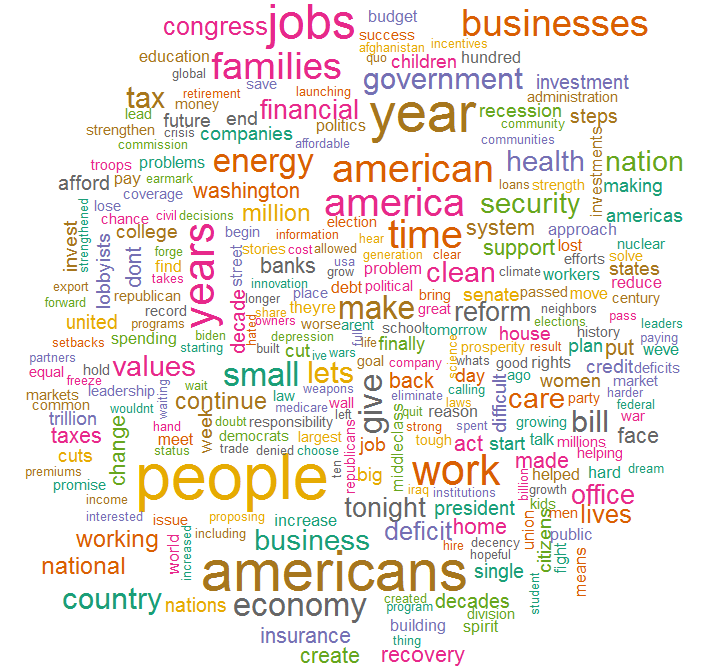
Again, variations of the word "America" are common. You don't see as much emphasis on crime and terrorism, but you do see a lot more emphasis on "financial" matters, "loans", "banks", the "economy", "health", "recovery" and the "deficit".
Side-by-Side Comparisons
An interesting side-by-side comparison can be made of the 2 speeches using a mosaic chart. The chart below shows a comparison of the relative frequency of each word that occurred at least 15 times in the 2 speeches combined:
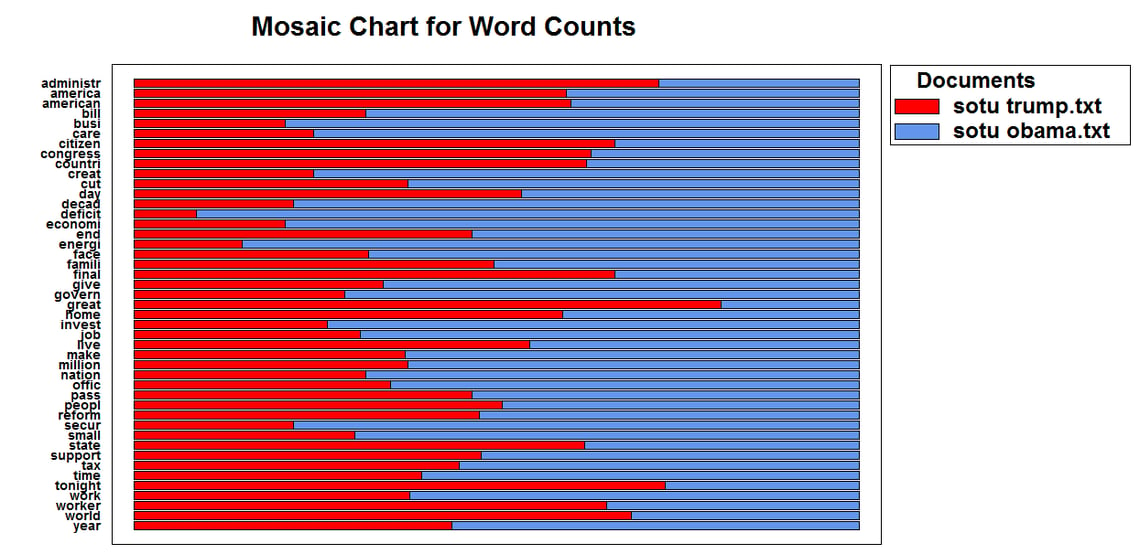
The length of each section of a bar reflects the proportion of times that each term occurred in the 2 speeches. If a word occurred the same proportion of time in each speech, then half the bar would be red and half would be blue. Common word endings have been removed, so that words like "job" and "jobs" are counted as a single term. There are some surprises, with Obama talking more frequently about the economy and Trump talking more frequently about the world.
Another useful device for comparing the speeches is a butterfly plot:
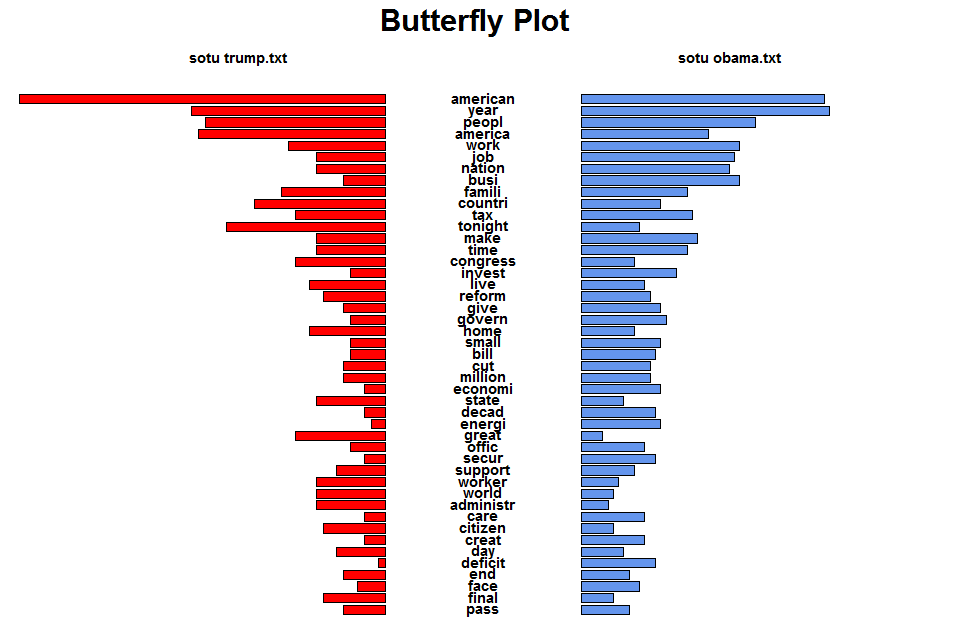
Here you see the terms (with common word endings removed) sorted from most frequent to least frequent. This plot shows similar information to the mosaic chart, with the terms sorted from most used to least used.
Clearly, a lot of information is contained in data that aren't numeric.


