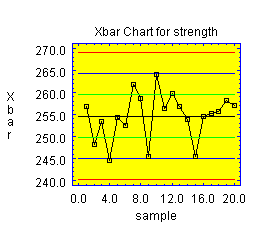
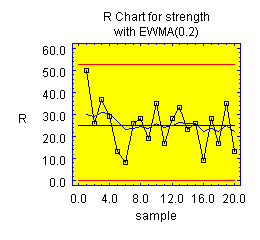
Purpose: SPC chart software that plots control charts for variables or attributes. Provides Statgraphics software with SPC tools.
DataSource for SPC Tools: ControlCharts.


| Name | Type | Description | Possible Values | Default Value |
| centerlineColor | Color | The color of the centerline. | Any valid Color. | Color.black |
| chartData | String | Contents of the chart, either a simple statistic or a smoothed value. | "Statistic", "MA","EWMA" |
"Statistic" |
| chartNumber | int | Chart to display (0=location, 1-scale). | 0,1 | 0 |
| connected | boolean | Whether to connect data values with a line. | true,false | true |
| controlLimitsColor | Color | The color of the control limits. | Any valid Color. | Color.red |
| decimalPlaces | int | Number of decimal places for displaying limits. | 0+, or -1 for default. | -1 |
| displayLimitValues | boolean | Whether the display the values for the control limits. | true,false | true |
| innerWarningLimitsColor | Color | The color of the outer warning limits. | Any valid Color. | Color.green |
| outerWarningLimitsColor | Color | The color of the inner warning limits. | Any valid Color. | Color.yellow |
| outOfControlPointType | String | The type to be used for the out of control point symbols. | "Rectangle","+","X", "Asterisk","Diamond", "Inverted Triangle", "Triangle", "Circle","Filled Rectangle", "Filled Circle" |
"Rectangle" |
| outOfControlPointColor | Color | The color of the out of control points. | Any valid Color. | Color.yellow |
| showCenterline | boolean | Whether to plot the centerline. | true,false | true |
| showControlLimits | boolean | Whether to plot the control limits. | true,false | true |
| showInnerWarningLimits | boolean | Whether to plot the inner warning limits. | true,false | false |
| showOuterWarningLimits | boolean | Whether to plot the outer warning limits. | true,false | false |
| showSpecificationLimits | boolean | Whether to plot any input specification limits. | true,false | true |
| showRunsRulesViolations | boolean | Whether the flag the location of any runs rules violations. | true,false | true |
| smootherColor | Color | The color of the smoother. | Any valid Color. | Color.blue |
| smootherParameter | double | Parameter for the EWMA smoother. | 0-1, exclusive. | 0.2 |
| smootherSpan | int | Number of terms in the MA smoother. | 2+ | 9 |
| smootherType | String | type of smoother to add to chart, if any. | "None", "MA", "EWMA" |
"None" |
| specificationLimitsColor | Color | The color of the specification limits. | Any valid Color. | Color.magenta |
Added January, 2019
| Name | Type | Description | Possible Values | Default Value |
| blockLegends | boolean | Whether control limit values should be displayed in a single block rather than level with control limits. | true,false | false |
| centerlineLabel | String | Label used in right margin when showing value of centerline. | Any string. | "CL = " |
| colorZones | boolean | Whether to color 1,2,3 sigma zones in green, yellow and red. | true,false | false |
| useDefaultXaxisScaling | boolean | Whether to use default scaling for X-axis. | true,false | true |
| useDefaultYaxisScaling | boolean | Whether to use default scaling for Y-axis. | true,false | true |
| xType | char | Type of data to be plotted on X-axis. | 'N','D','M',"T" or 'S' for numeric data, dates, months, times (HH:MM), or extended times (HH:MM:SS). | 'N' |
Other properties for this SPC chart software are inherited from the java.awt.Canvas class and from the general GraphicalStatbean class.
Code Sample - see ControlCharts.

© 2025 Statgraphics Technologies, Inc.
The Plains, Virginia
CONTACT US
Have you purchased Statgraphics Centurion or Sigma Express and need to download your copy?
CLICK HERE