

Published under: data visualization, data forecasting, statistical analysis, data analysis, Forcasting, analytics software
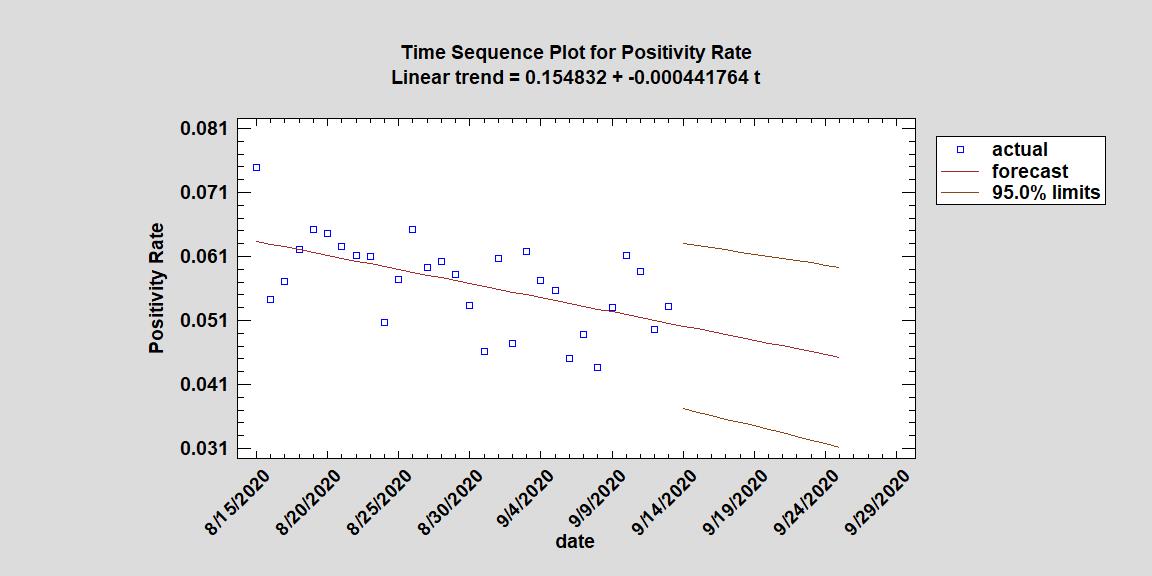
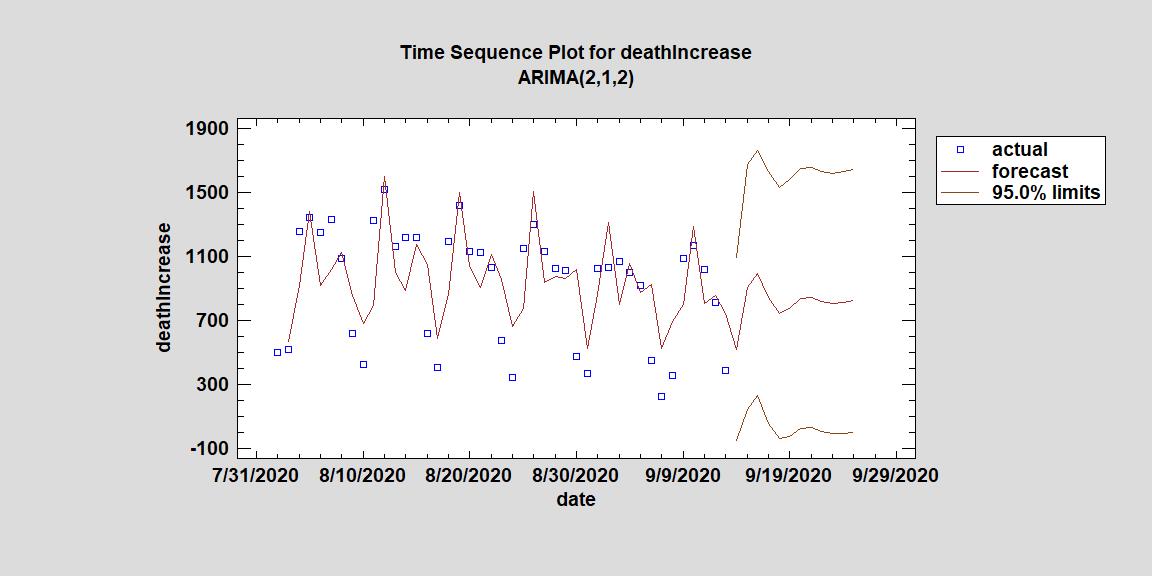
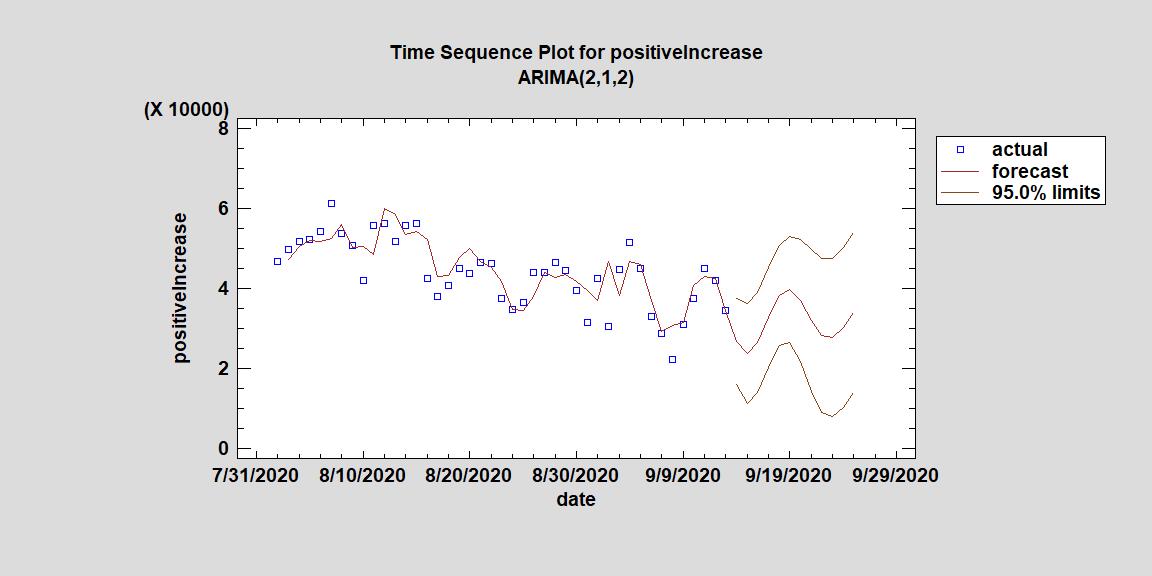
The Statgraphics Team reviewed the daily data from state and local levels regarding COVID-19 for the United States and discovered a few positive trends. First, the positivity rate continues to lower (see Plot 1). In fact, it may continue to decrease to 4.5% in the next two weeks. Second, the forecast for the number of daily deaths in America is also downward trending (see Plot 2). The daily death total may decrease to around 800 per day in two weeks. This is a decline from the projected 1000 deaths per day we and other data scientists estimated in earlier forecasts. Finally, the forecast for the number of positive tests in America is downward trending as well (see Plot 3). Although there is a decline, our forecast still predicts between 24,000 and 40,000 positive tests a day. Although this many positive tests per day is not where a country wants to be, it is a positive sign that the number is lowering. The data does not suggest that the daily deaths from COVID-19 or the number of positive tests will be approaching zero anytime soon. However it is certainly positive news that the number of positive tests, daily deaths, and the positivity rate are forecast to decline. It should be noted that many health officials and scientists expect an uptick in deaths and positive tests when the flu season begins. The forecasting models displayed here only use the historical data in the USA for each particular variable and no other factors.
Plot 1. Forecasting Model for the Positivity Rate in the USA for COVID-19
Plot 2. Forecasting Model for Daily Deaths in the USA from COVID-19
Plot 3. Forecasting Model for the Number of Daily Positive Tests in the USA from COVID-19
*These forecast models and images were created using our leading data analysis program, Statgraphics Centurion 19.


