Version 19 Release Notes
Important note: When installing a new build, do not uninstall the previous build. The new build will replace the previous build and will not require reactivation.
Version 19.6.05 posted December 1, 2024
Corrections:
- Fixed problem importing cells containing “NA” from Excel.
Enhancements:
- Improved default axis scaling when maximum value equals 0.
Version 19.6.04 posted August 13, 2024
Corrections:
1. Fixed column type display when dynamically changing languages.
2. Enhanced ability to link together multiple StatFolios.
3. Fixed problem when specifying parameters on control charts involving certain transformations.
4. Fixed problem doing quantile regression when numeric predictor had value labels.
Enhancements:
1. Allows use of Analysis Options dialog box when Analysis Summary is not displayed.
2. Control charts now allow interactive exclusion of points when subgroup statistics are input.
Version 19.6.03 posted January 25, 2024
Corrections:
1. In Principal Components Analysis, corrected problem when number of variables exceeded the number of cases.
2. Allowed character labels on X-axis for control charts.
3. Fixed histogram scaling problem caused by rounding.
4. Fixed inconsistencies in CSV format for some Python procedures.
Version 19.6.02 posted November 20, 2023
Corrections:
1. Fixed problem executing Python and R scripts when data contained accented characters.
2. Fixed problem dragging legends on 3D plot in accelerated life testing.
3. Improved ability to tabulate predicted values in Simple Regression.
4. Eliminated potential error when switching from Weibull to lognormal distribution when fitting distributions to arbitrarily censored data.
Version 19.6.01 posted November 3, 2023
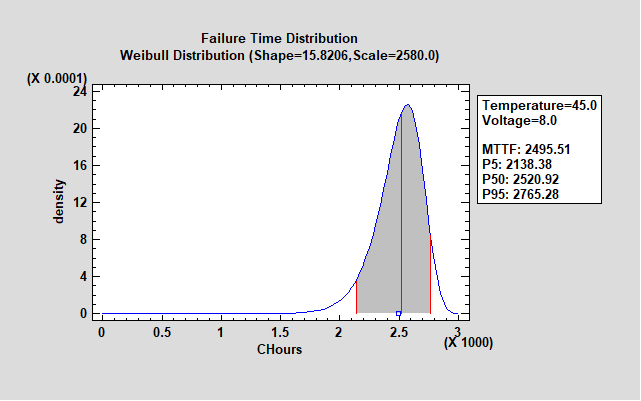
Version 19.6 contains several improvements to the life data analysis procedures:
- The Life Data Regression procedure has been changed as follows:
- It now accepts left, right or interval censored data.
- A new graph has been added to display the failure time distribution.
- The mean time to failure (MTTF) is displayed together with the percentiles.
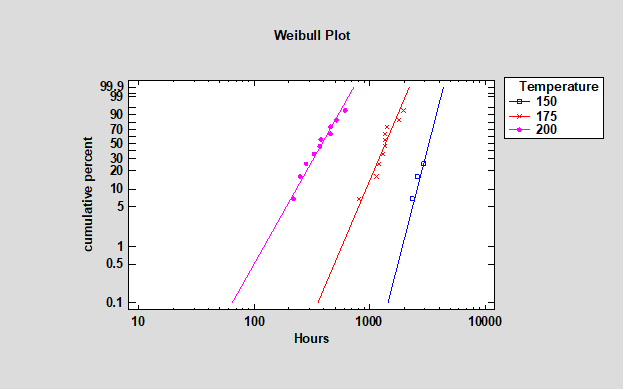
- The Arrhenius Plot procedure has been changed as follows:
- It has been renamed Accelerated Life Data Plots.
- It allows for fitting any of 6 acceleration models, not just the Arrhenius model:
- Arrhenius
- Inverse power rule
- Exponential
- Eyring
- Linear
- Reciprocal
- It allows for automatic conversion to degrees Kelvin if the data is entered as degrees C.
- A new procedure called Accelerated Life Testing has been added. It is designed to take raw data consisting of failure times and/or censoring times and fit regression models similar to those fit by the Life Data Regression procedure. The major differences from that procedure are:
- There must be at least 1 quantitative accelerating variable.
- That variable is assumed to follow one of the 6 acceleration models listed above.
- Additional quantitative and categorical variables may be added to the model as linear terms.
- The assumed life data distribution may be either exponential, extreme value, logistic, loglogistic, lognormal, normal or Weibull. The allowable distributions depend on the selected acceleration model.
- Plots are created at each observed value of the accelerating factor.
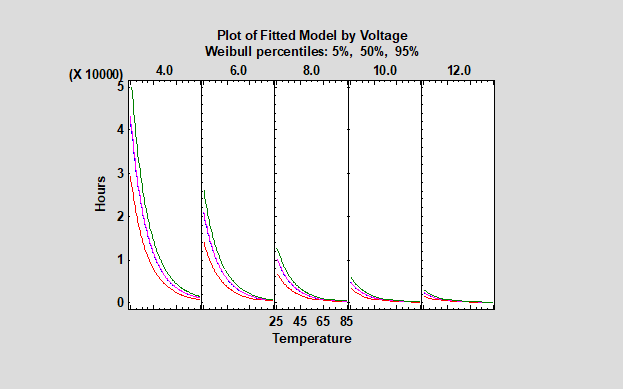
Note that the data entered are observed failure or censoring times, not percentiles as in the Accelerated Life Data Plots procedure.
Version 19.5.01 posted April 14, 2023
New Features: (click here for a complete list)
1. New procedures for ordinal and multinomial regression.
2. Optional input of values and frequencies in One Variable Analysis.
3. Use of letters to indicate groups created by multiple range tests.
4. Vertical labels on barcharts.
5. New Mann-Whitney and Kruskal-Wallis tests for contingency tables.
6. Trellis plots added to many regression procedures.
7. Drag-and-drop factor level reordering added to several procedures.
Corrections:
1. General Linear Models - corrected behavior of response surface explorer. Added multiple range tests for models with interactions.
2. Added text - now permits font change for text added to graph.
3. Oneway ANOVA - now useable when data opened as an experiment file.
4. Taguchi DOE - interactions may now be added to the analysis.
5. Cox Proportional Hazards - corrected display of second factor level on hazard function plot.
Version 19.4.04 posted January 30, 2023
New Features:
1. Colored background may now be specified for StatBoxes superimposed on graphs to display numerical results.
Corrections:
1. Fixed problem with data sometimes not appearing in datasheet after merging 2 data files.
2. In Multiple Regression, selection now applied immediately when using the Repeat By option to create multiple analyses.
Version 19.4.03 posted January 10, 2023
New features:
1. Allows results from DOE Wizard to be saved in datasheet B.
2. Allows rescaling of numeric right axis in Multiple X-Y Plot.
3. Radar/Spider Plot now allows missing factor combinations.
Corrections:
1. Changed column type to numeric when saving labels in Tabulation when input column has value labels.
2. Fixed saving of results in Multiple Correspondence Analysis.
3. Fixed problem with dialog box when dynamically rotating 3D plots.
Version 19.4.02 posted October 5, 2022
Corrections:
1. Fixed scaleup feature for points when saving graph in image file.
2. Fixed intermittent crash when pasting graphs into StatGallery.
Version 19.4.01 posted June 20, 2022
New features (see them here):
- Improved contour plots
- New transformations for binary data in DOE Wizard
- Choice of transparent or opaque graphics text
- Choice of methods for activating academic site licenses
Corrections:
- Fixed wrapping of long lines in audit trail files
- Allowed time indices to be omitted in Open-High-Low-Close plots
- Corrected StatAdvisor comment in Capability Control Charts
- Allowed for foreign language delimiters in alarm files
Version 19.3.03 posted March 17, 2022
New features:
- Reduced size of table cells in all SnapStats to improve fit on page.
Corrections:
- In StatLink, fixed automatic polling of data files.
Version 19.3.02 posted February 8, 2022
New features:
- Trellis plots for summarizing the relationship between 3 numeric variables (Z vs X and Y) by 1 or 2 conditioning variables (bubble charts, regression fits and nonparametric smoothing).
- Alternative choice of data input structure for crosstabulation where levels are defined by multiple data columns.
Corrections:
- Fixed Y-axis scaling dialog box for trellis plots.
- Changed Recode Data behavior to differentiate between uppercase and lowercase.
Version 19.3.01 posted January 20, 2022
New features:
- Trellis plots for summarizing numeric data by 1 or 2 conditioning variables (multiple boxplots, histograms and normal probability plots).
- Trellis plots for summarizing categorical data by 1 or 2 conditioning variables (multiple barcharts, piecharts and donut charts).
- Trellis plots for summarizing the relationship between 2 numeric variables by 1 or 2 conditioning variables (multiple smoothed scatterplots and regression lines).
- Academic site license build changed to make it easier to run on virtual machines.
Corrections:
- Fixed saved labels in Crosstabulation for data columns that have optional value labels.
- Enabled conversion of character labels to dates in DataBook.
- Updated location of R libraries required for Analysis of Arbitrarily Censored Data and for Decision Forests.
Version 19.2.02 posted September 13, 2021
New features:
- Increased factor limit for extreme vertices mixture designs to 7.
- Increased variable limit in multivariate normal random number generator to 16.
- Added confidence limits for optimized response value in DOE procedures.
- Added support for weighting observations in Support Vector Machines.
- Added support for value labels in Quantile Regression.
Corrections:
- Fixed default scaling in some residual plots.
- Fixed crash when computing Studentized residuals if all but 1 value fell perfectly on a straight line.
Version 19.2.01 posted March 10, 2021
New procedures:
- Dynamic Pareto Chart (under Statlets - Data Columns)
- Dynamic Radar/Spider Plot (under Statlets - Data Columns)
- Time Series Spiral Plot (under Statlets - Data Columns)
- Support Vector Machines (under Interfaces - Python)
- Fitting Non-Normal Mixture Distributions (under Interfaces - R)
Other new features:
- Point symbols placement in legend boxes improved.
- New option added to control mouse cursor sensitivity when clicking to identify points on a graph.
Corrections:
- Improved handling of missing values in Bivariate Mixture Distribution Fitting.
- A graph title was fixed in Zero Inflated Count Regression.
- Fixed problem with ODBC queries when using 64-bit system.
Version 19.1.03 posted December 29, 2020
New Features:
- In Multiple Variable Analysis, may now choose whether to display sample sizes and P-values in correlation matrix tables.
- In Cluster Analysis and K-Means Clustering, may now draw convex hulls around each cluster in 2-D scatterplots.
- Optional value labels added to barcharts in Barchart, Multiple Barchart, Frequency Tabulation, Frequency Tables, Contingency Tables and Crosstabulation.
- Condition number added to summary of experimental designs in DOE Wizard.
- Added pane in K-Means Clustering to display any messages from Python. Also removed the option to precompute distances since that option is no longer valid in Scikit-Learn library.
Corrections:
- Improved drawing of contour lines in Distribution Fitting (Bivariate Mixture Distributions).
- Fixed crash when using Rotate button on ribbon bar.
- Prevented operations such as Rename, Copy and Repeat for the DOE Wizard window.
- In Stability Analysis, fixed error caused by estimating some nonlinear models when X=0.
- Fixed problem loading StatFolio when connected to old .sfx file.
Version 19.1.02 posted November 27, 2020
New Features:
- Output displayed when fitting most DOE models now displays Prediction Sum of Squares (PRESS) and Predicted R-Squared.
- Diagnostic plots when fitting most DOE models now give choice of displaying ordinary or Studentized residuals.
- In Automatic Forecasting, algorithm will now consider ARIMA models containing a constant even if differencing is not considered.
Corrections:
- In DOE Wizard, fixed problem in Augment Design when adding additional runs.
- In StatGallery, fixed problem with legend box overwriting itself when overlaying a second graph.
- In Heat Map, fixed problem when dealing with a large amount of data.
Version 19.1.01 posted October 1, 2020
Initial release of Statgraphics Centurion 19.


