

Published under: data forecasting, statistical analysis, data analysis, ARIMA models, Forcasting
The number of positive cases for COVID-19 in the United States per day has more than doubled in one month (36890 positive tests on 9/29/20 compared to 88452 on 10/29/20)*. The positivity rate which was under 4% a few weeks ago (3.9% on 10/5/20) has nearly doubled to 6.7% on 10/29/20. An increase in the positivity rate and positives tests usually means there will be an increase in deaths from COVID-19. Daily deaths in the USA were in decline after the initial outbreak but now are no longer forecast to lower (see Chart 1) The Statgraphics Team expects around 800 people to die per day for the next two weeks which means the country would reach a total of 240,000 to 250,000 deaths from COVID-19 in the next month. Thankfully, our models do not pick up an upward trend for deaths using the ARIMA models, but other models and the raw data suggest otherwise. The forecast for the positivity rate in the next two weeks ranges from staying around 6.5% to even approaching 8% (see Chart 2 and 3). It is clear from the data and forecasting models that COVID-19 is no longer slowing down in the USA. We expect around 75,000 new positive tests per day for the next twelve days (see Chart 4), but some of our models forecast it could reach 100,000 per day in two weeks (see Chart 5).
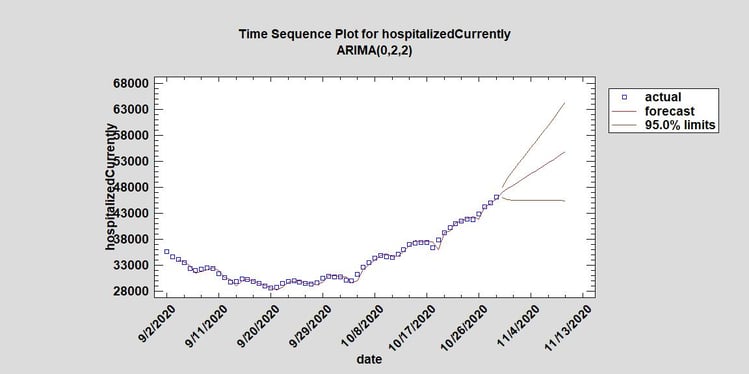
One of the biggest issues for our country regarding COVID-19 will continue to be the number of people hospitalized and if our hospitals have the resources necessarily to properly treat them. The number of new people hospitalized from COVID-19 is forecast to continue its rise (see Chart 5). If current hospitalizations from COVID-19 follow our model, we would expect the number to rise to around 55,0000 in twelve days. The country hasn’t had this many people hospitalized for COVID-19 in three months when we had 54,470 people on 8/1/20. Sadly the country was at a low nearly a month ago (28608 on 9/20/20). The current number of people hospitalized for COVID-19 yesterday was 46095 which means it rose over 60% in less than 40 days.
As we mentioned, it is expected that deaths from COVID-19 will increase with the feared second wave. We will continue to monitor the daily state and local data and want everyone to continue to practice social distancing and wash your hands regularly to prevent the spread of germs and viruses.
Chart 1: ARIMA Model for Death Increase Per Day in the USA from COVID-19
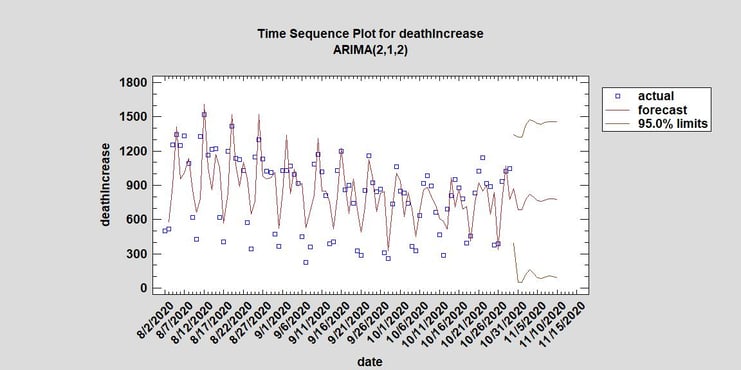
Chart 2: ARIMA Model for the Positivity Rate in the USA since 9/2/2020
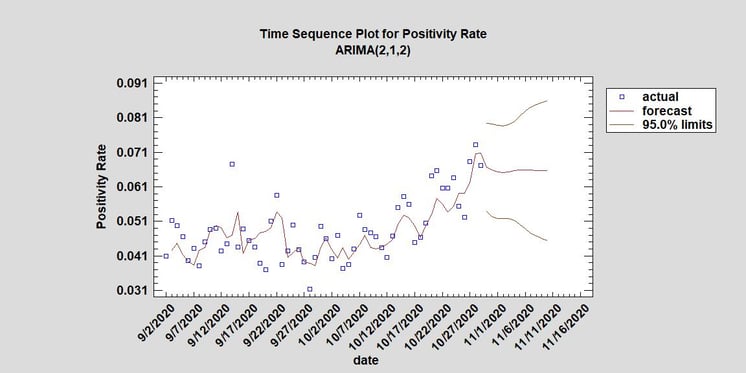 Chart 3: Quadratic Trend for the Positivity Rate in the USA
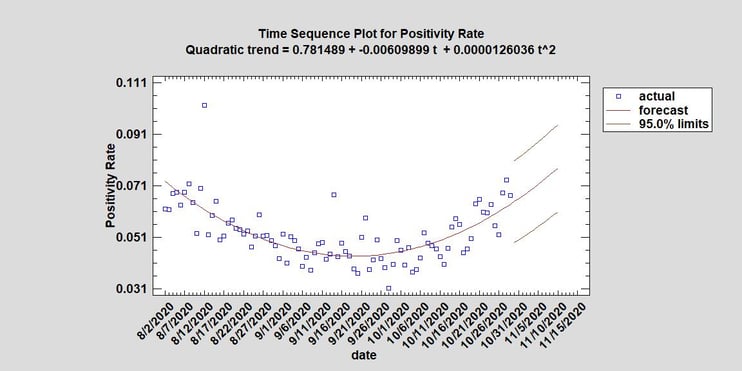 Chart 4: ARIMA Model for Daily Positives Tests from COVID-19 in the USA
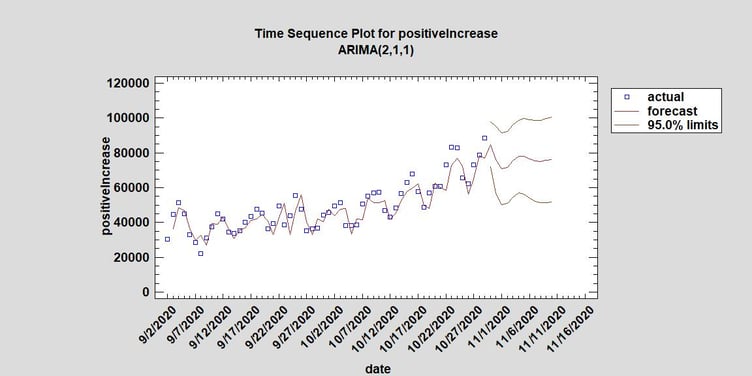
Chart 5: Holt's Linear Exp. Smoothing Model for Daily Positives Tests from COVID-19 in the USA
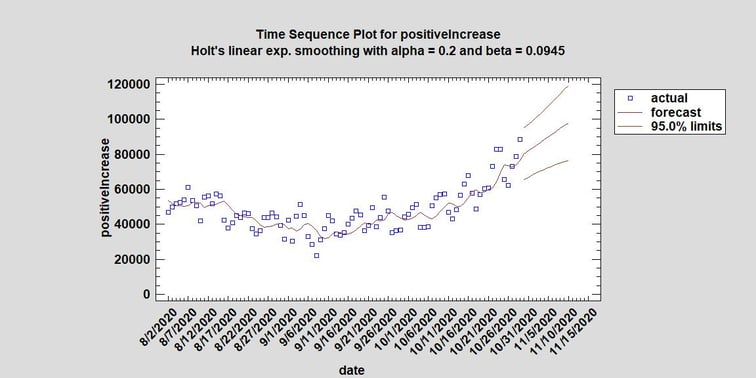 Chart 6: ARIMA Model for Hospitalized Currently from COVID-19 in the USA
*Data Source for COVID-19 information: https://covidtracking.com/data/api.


