Published under: data analysis, Data analytics, Statgraphics, Multivariate methods, Cluster analysis, Principal Components, ANOVA
Using Multivariate Statistics to Fingerprint Tequila Brands
Did you know that every brand of tequila has a unique fingerprint? If not, you should take a close look at the article titled "Assessment of Physicochemical Properties of Tequila Brands: Authentication and Quality" which was published in the Journal of Chemistry in June, 2016. Alejandra Carreon-Alvarez, Amaury Suárez-Gómez, Florentina Zurita, Sergio Gómez-Salazar, J. Felix Armando Soltero, Maximiliano Barcena-Soto, Norberto Casillas, Porfirio-Gutierrez, and Edgar David Moreno-Medrano used several Statgraphics multivariate analysis procedures to characterize 53 brands of tequila. The properties analyzed included conductivity, density, pH, refractive index, sound velocity, and viscosity. Once obtained, the fingerprints may be used to authenticate additional samples and for quality control and process improvement.
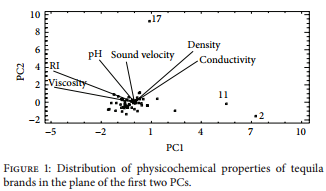
The first step in their analysis was to apply the Statgraphics Principal Components procedure. 70% of the variability in those 6 properties was captured by the first 2 principal components. Notice in the Biplot shown below how brands #2 and #11 load highly on the first principal component, which appears to be defined primarily by density, conductivity, RI and viscosity. Brand #17 is distinguished from all of the other brands by its location with respect to the second principal component.
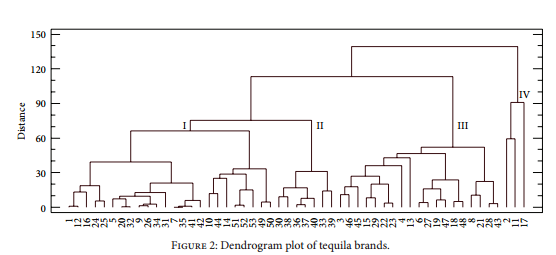
 They then used the Statgraphics Cluster Analysis procedure to create groups of similar brands using the 6 properties. The Dendrogram below groups the 53 brands into 4 clusters. Read their article for an interesting interpretation of the clusters.
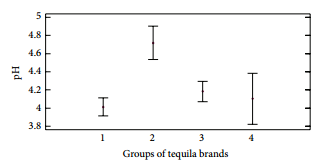
 After creating the clusters, the researchers then used the Statgraphics Analysis of Variance procedure to demonstrate which clusters differed significantly from which other clusters using Fisher's LSD intervals.
 This very interesting application shows the power of multivariate statistical methods. While any single variable did not do a good job at distinguishing amongst the brands, the 6 physicochemical properties taken together did.
NOTE: This is one of almost 15,000 scholarly articles published during the last 4 years using analyses performed by Statgraphics.

 By:
By: 


