Multivariate statistical methods are used to analyze the joint behavior of more than one random variable. There are a wide range of multivariate techniques available, as may be seen from the different statistical method examples below. These techniques can be done using Statgraphics Centurion 19's multivariate statistical analysis.
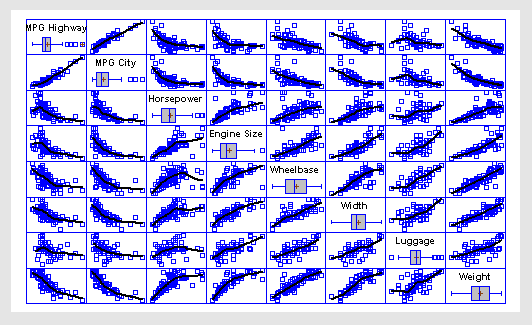
More:Matrix Plot.pdf
The Multiple-Variable Analysis (Correlations) procedure is designed to summarize two or more columns of numeric data. It calculates summary statistics for each variable, as well as correlations and covariances between the variables. The graphs include a scatterplot matrix, star plots, and sunray plots. This procedure is often used prior to constructing a multiple regression model.
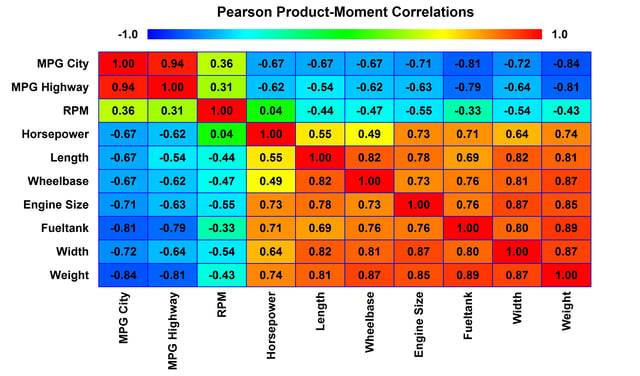
More: Multiple Variable Analysis.pdf
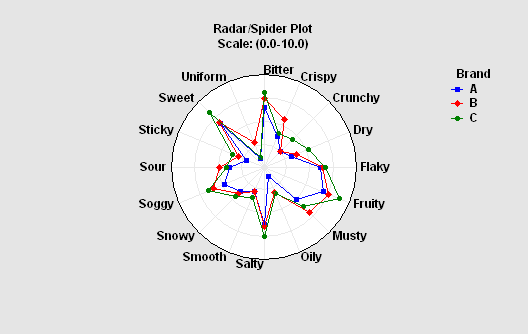
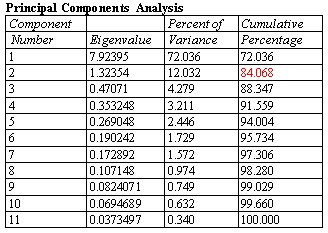
A principal components or factor analysis derives linear combinations of multiple quantitative variables that explain the largest percentage of the variation amongst those variables. These types of analyses are used to reduce the dimensionality of the problem in order to better understand the underlying factors affecting those variables. In many cases, a small number of components may explain a large percentage of the overall variability. Proper interpretation of the factors can provide important insights into the mechanisms that are at work.
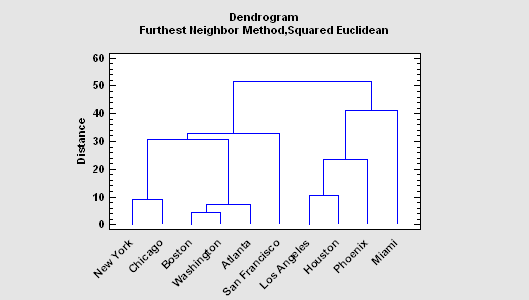
More:Cluster Analysis.pdf
1. to be able to describe observed cases mathematically in a manner that separates them into groups as well as possible. 2. to be able to classify new observations as belonging to one or another of the groups.
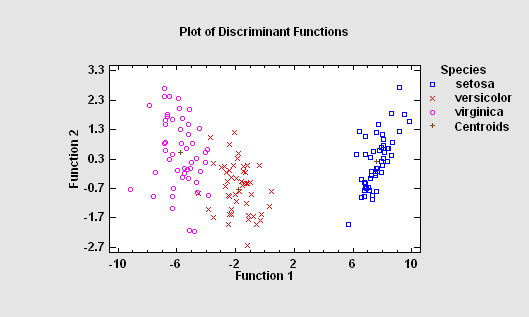
More:Discriminant Analysis.pdf
The Neural Network Classifier implements a nonparametric method for classifying observations into one of g groups based on p observed quantitative variables. Rather than making any assumption about the nature of the distribution of the variables within each group, it constructs a nonparametric estimate of each group’s density function at a desired location based on neighboring observations from that group. The estimate is constructed using a Parzen window that weights observations from each group according to their distance from the specified location.
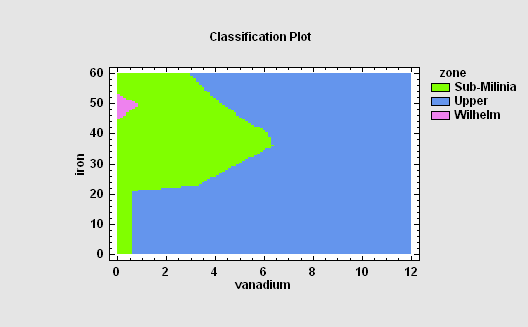
More:Neural Network Classifier.pdf
Partial Least Squares is designed to construct a statistical model relating multiple independent variables X to multiple dependent variables Y. The procedure is most helpful when there are many predictors and the primary goal of the analysis is prediction of the response variables. Unlike other regression procedures, estimates can be derived even in the case where the number of predictor variables outnumbers the observations. PLS is widely used by chemical engineers and chemometricians for spectrometric calibration.
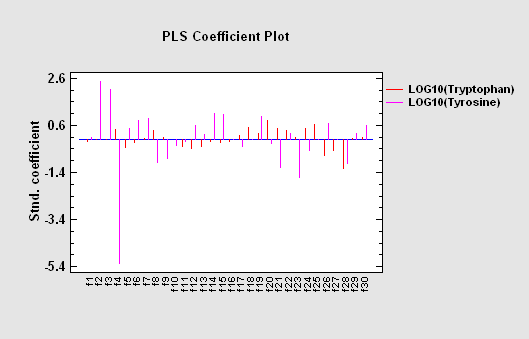
More:Partial Least Squares.pdf
The Canonical Correlations procedure is designed to help identify associations between two sets of variables. It does so by finding linear combinations of the variables in the two sets that exhibit strong correlations. The pair of linear combinations with the strongest correlation forms the first set of canonical variables. The second set of canonical variables is the pair of linear combinations that show the next strongest correlation amongst all combinations that are uncorrelated with the first set. Often, a small number of pairs can be used to quantify the relationships that exist between the two sets.
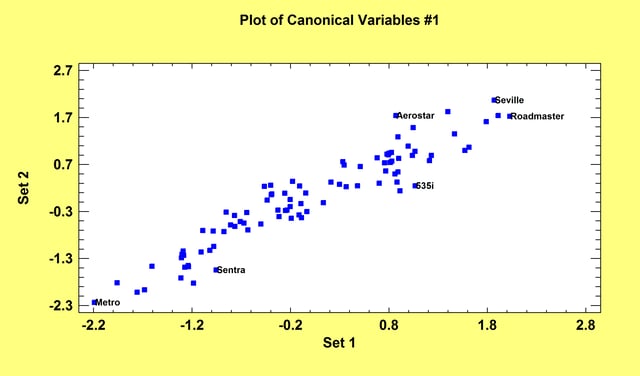
More: Canonical Correlations.pdf
This procedure tests whether a set of random variables could reasonably have come from a multivariate normal distribution. It includes Royston’s H test and tests based on a chi-square plot of the squared distances of each observation from the sample centroid.
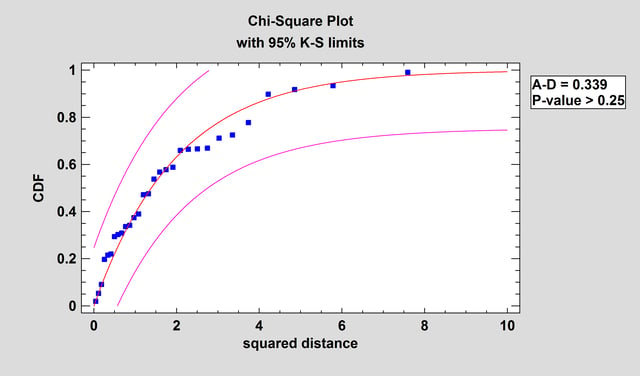
More: Multivariate Normality Test.pdf or Watch Video
The Multivariate Tolerance Limits procedure creates statistical tolerance limits for data consisting of more than one variable. It includes a tolerance region that bounds a selected p% of the population with 100(1-alpha)% confidence. It also includes joint simultaneous tolerance limits for each of the variables using a Bonferroni approach. The data are assumed to be a random sample from a multivariate normal distribution. Multivariate tolerance limits are often compared to specifications for multiple variables to determine whether or not most of the population is within spec.
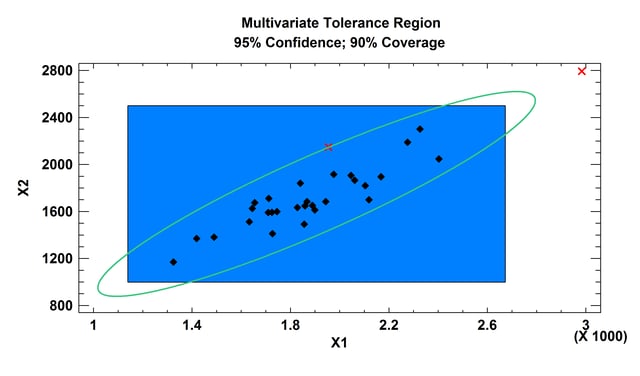
More: Multivariate Tolerance Limits.pdf
The Multidimensional Scaling procedure is designed to display multivariate data in a low-dimensional space. Given an n by n matrix of distances between each pair of n multivariate observations, the procedure searches for a low-dimensional representation of those observations that preserves the distances between them as well as possible. The primary output is a map of the points in that low-dimensional space (usually 2 or 3 dimensions).
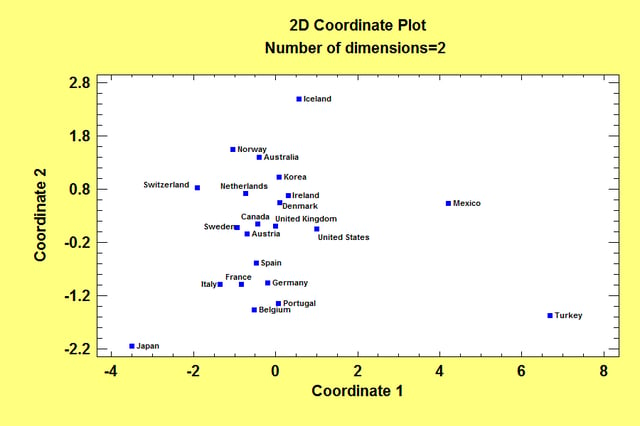
More: Multidimensional Scaling.pdf or Watch Video

© 2025 Statgraphics Technologies, Inc.
The Plains, Virginia
CONTACT US
Have you purchased Statgraphics Centurion or Sigma Express and need to download your copy?
CLICK HERE