Version 19.6 of Statgraphics introduces a new procedure for accelerated life testing. The procedure fits various models to observed failure times collected under higher than normal levels of one or more stress variables. The fitted models are then extrapolated to estimate the failure time distribution under normal operating conditions.
The new procedure estimates 6 common acceleration models:
The distribution of failure times is assumed to follow one of the following distributions:
The data analyzed by the new procedure consists of observed failure times, which may be censored. The procedure supports any combination of right-censored, left-censored, or interval-censored data. A typical dataset is shown below:

There must be one primary accelerating factor such as temperature which is assumed to follow one of the acceleration models. Additional categorical and quantitative factors such as voltage may also be added to the model. Arbitrarily censored data is best entered using the special censored numeric data type as shown in the rightmost column.
Fitted Acceleration Model
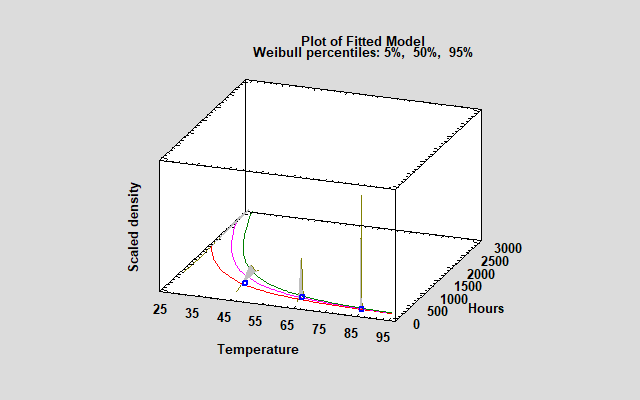
A typical acceleration model is shown below:

The graph shows an Arrhenius/Weibull model fit to data at 45, 65 and 85 degrees C. Extrapolating the results to 25 degrees gives the following estimate of the failure time distribution:

The estimated mean time to failure (MTTF) when temperature = 25ºC is approximately 2,460 hours. The central 90% of the fitted distribution ranges from 1,594 hours to 3,209 hours.
More Information
More information about the new Accelerated Life Testing procedure may be found here.

© 2025 Statgraphics Technologies, Inc.
The Plains, Virginia
CONTACT US
Have you purchased Statgraphics Centurion or Sigma Express and need to download your copy?
CLICK HERE