
An important technique for analyzing the effect of categorical factors on a response is to perform an Analysis of Variance. An ANOVA decomposes the variability in the response variable amongst the different factors. Depending upon the type of analysis, it may be important to determine: (a) which factors have a significant effect on the response, and/or (b) how much of the variability in the response variable is attributable to each factor.
Statgraphics Technologies products provide several procedures for performing an analysis of variance:

| Procedure | Statgraphics Centurion 18/19 | Statgraphics Sigma express |
Statgraphics stratus |
Statgraphics Web Services |
StatBeans |
|---|---|---|---|---|---|
| One-Way ANOVA |  |
|
|
|
|
| Multifactor ANOVA | |
|
|
|
|
| Variance Components Analysis | |
||||
| General Linear Models | |
||||
| Repeated Measures ANOVA | |
A one-way analysis of variance is used when the data are divided into groups according to only one factor. The questions of interest are usually: (a) Is there a significant difference between the groups?, and (b) If so, which groups are significantly different from which others? Statistical tests are provided to compare group means, group medians, and group standard deviations. When comparing means, multiple range tests are used, the most popular of which is Tukey's HSD procedure. For equal size samples, significant group differences can be determined by examining the means plot and identifying those intervals that do not overlap.

More: One-Way ANOVA.pdf
When more than one factor is present and the factors are crossed, a multifactor ANOVA is appropriate. Both main effects and interactions between the factors may be estimated as part of this ANOVA test. The output includes an interaction plot, which shows the estimated mean response at each combination of 2 factors. Note the strong interaction between body fat and smoking in the plot at the left.

More: Multifactor ANOVA.pdf

A Variance Components Analysis is most commonly used to determine the level at which variability is being introduced into a product. A typical experiment might select several batches, several samples from each batch, and then run replicates tests on each sample. The goal is to determine the relative percentages of the overall process variability that is being introduced at each level.

More: Variance Components Analysis.pdf
The General Linear Models procedure is used in analysis of variance whenever the above procedures are not appropriate. It can be used for models with both crossed and nested factors, models in which one or more of the variables is random rather than fixed, and when quantitative factors are to be combined with categorical ones. Designs that can be analyzed with the GLM procedure include partially nested designs, repeated measures experiments, split plots, and many others. For example, pages 536-540 of the book Design and Analysis of Experiments (sixth edition) by Douglas Montgomery (Wiley, 2005) contains an example of an experimental design with both crossed and nested factors. For that data, the GLM procedure produces several important tables, including estimates of the variance components for the random factors.
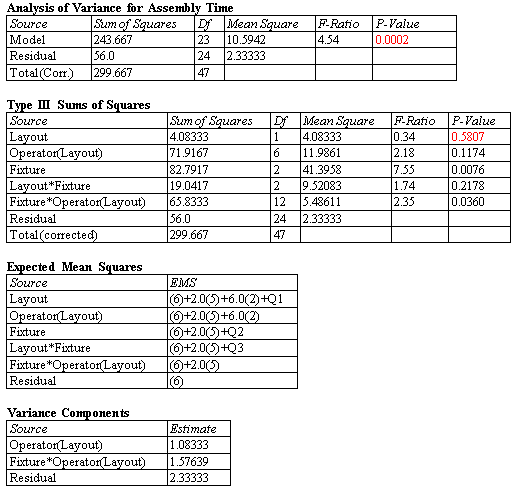
More: General Linear Models.pdf
A Repeated Measures ANOVA analyzes experimental designs in which multiple measurements have been made on the same subjects, and in which one or more factors differentiate the subjects. In many cases, the measurements are taken sequentially in order to examine how the effects of the between-subject factors vary over time.
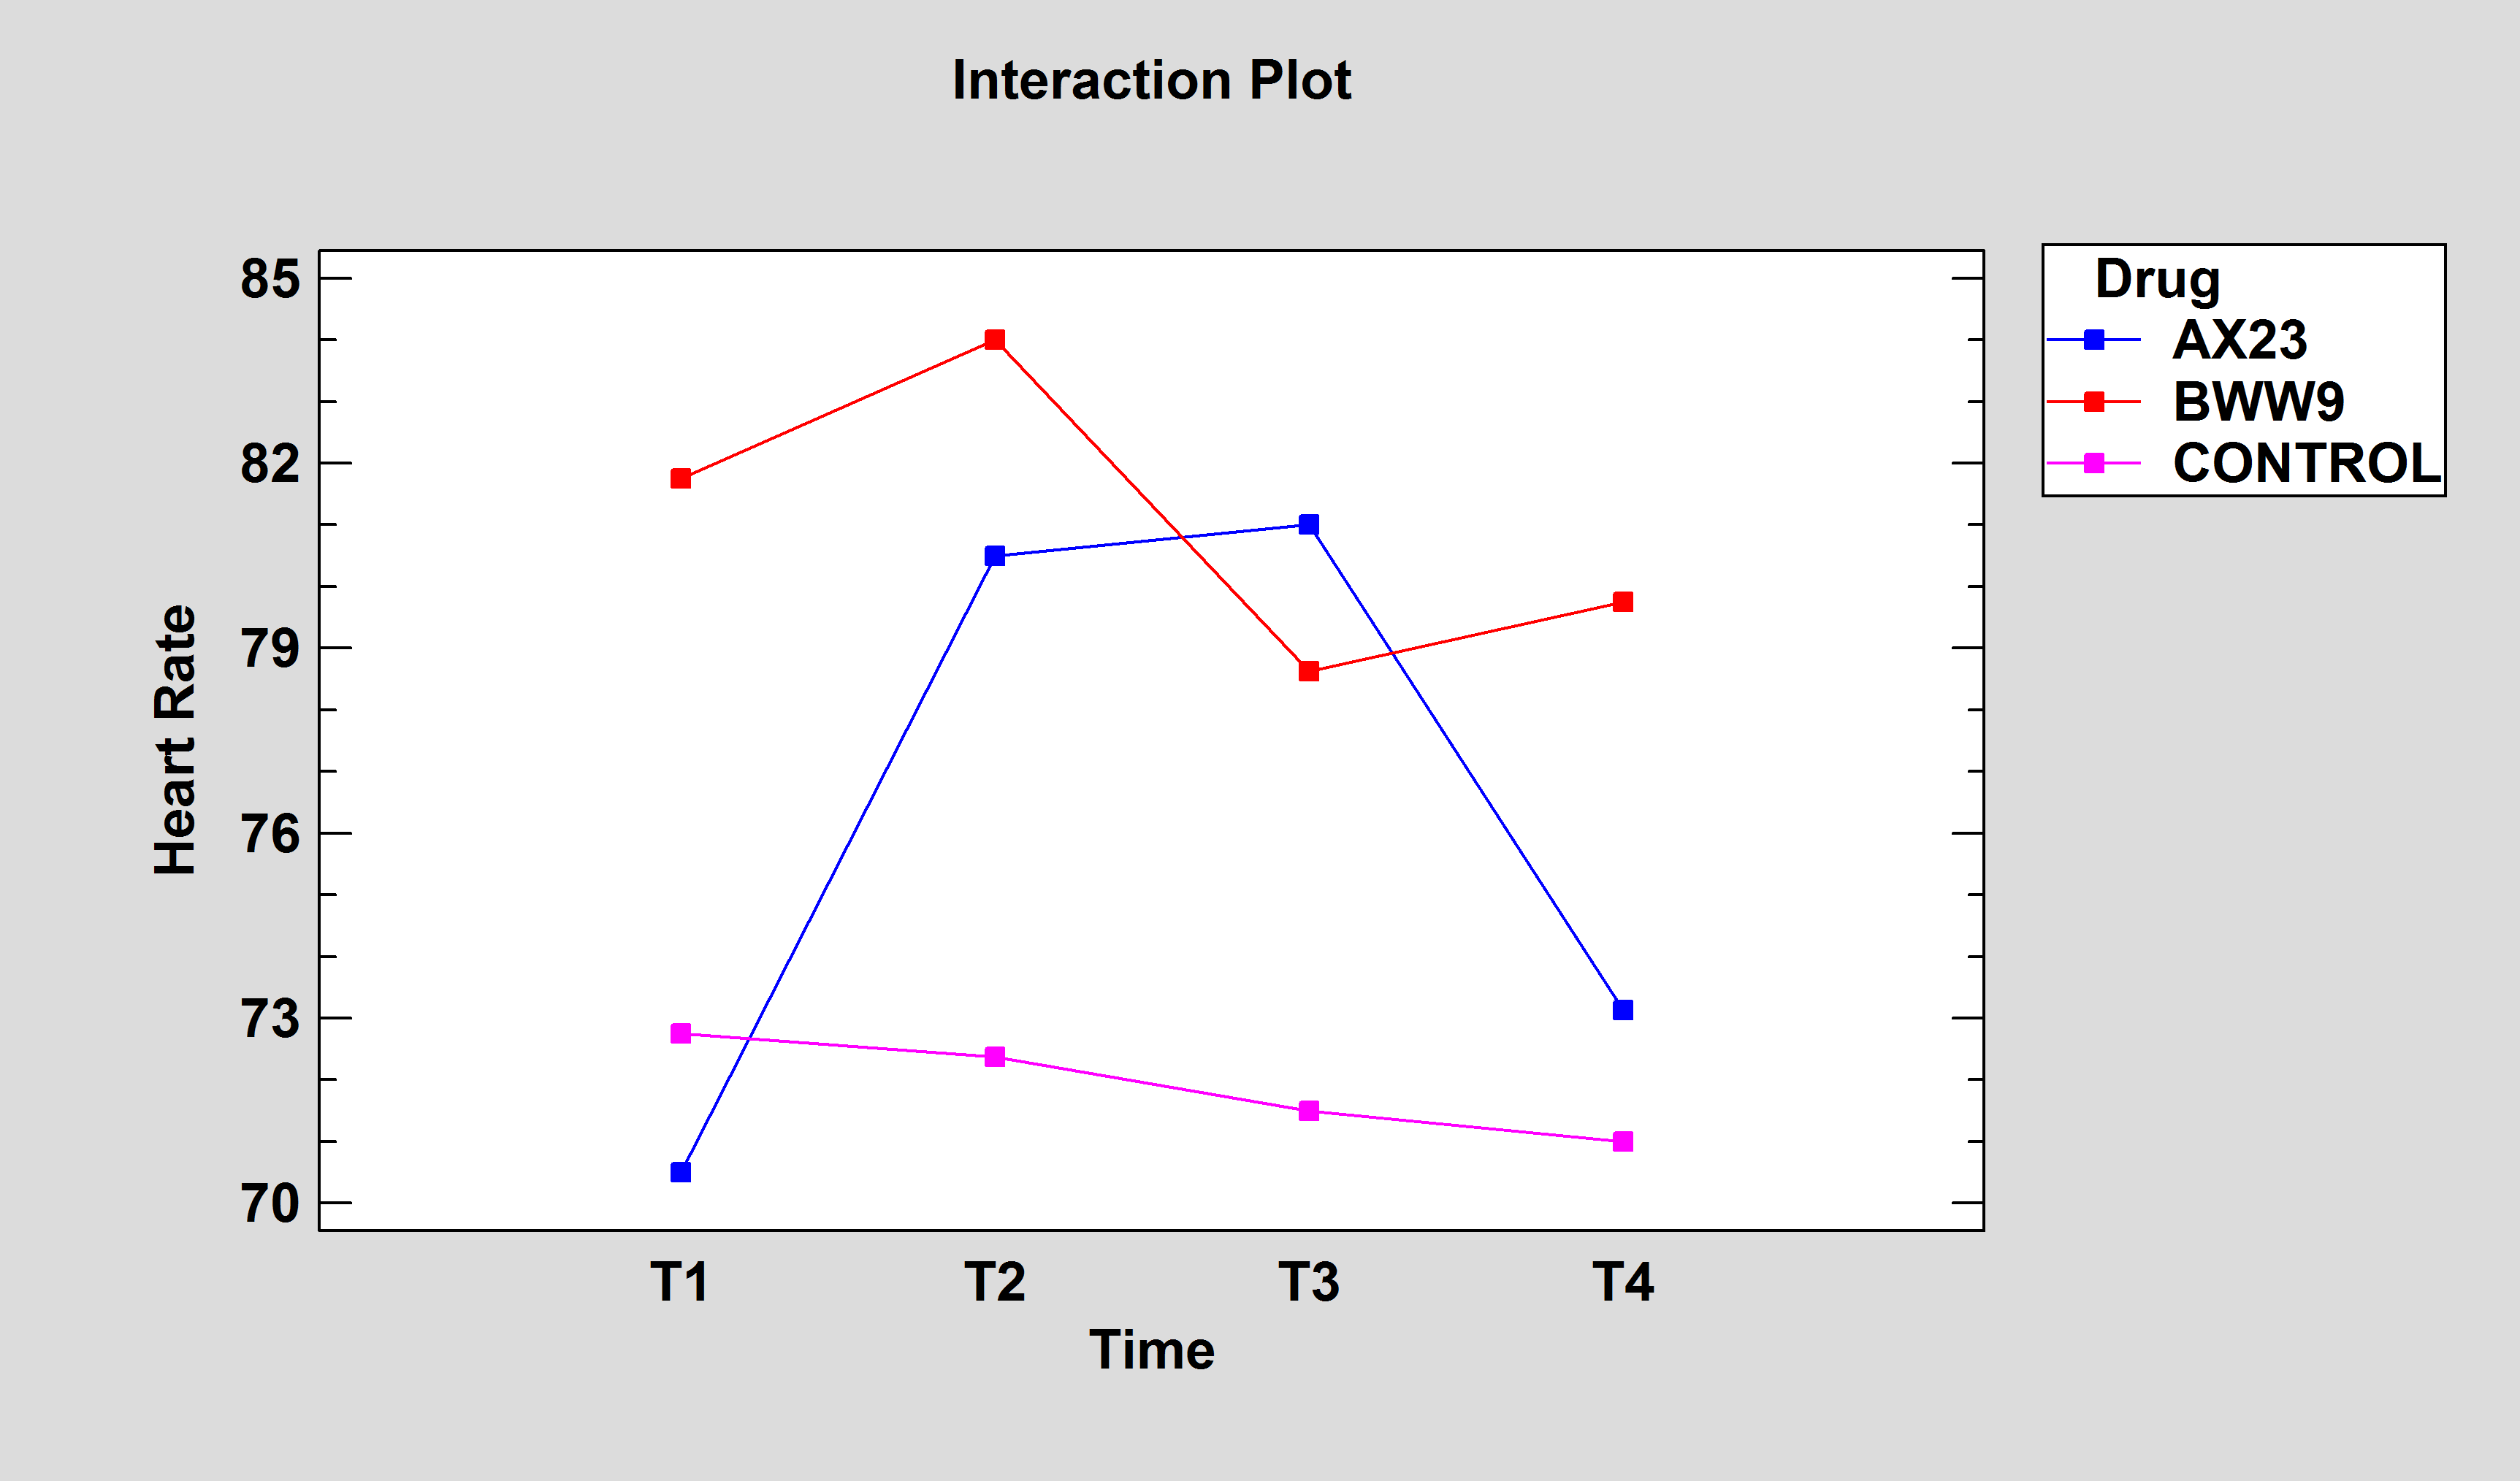
More: One-Way Repeated Measures ANOVA.pdf, Factorial Repeated Measures ANOVA.pdf


© 2025 Statgraphics Technologies, Inc.
The Plains, Virginia
CONTACT US
Have you purchased Statgraphics Centurion or Sigma Express and need to download your copy?
CLICK HERE


