An important technique used to determine how well a process meets a set of specification limits is called a process capability analysis. A capability analysis is based on a sample of data taken from a process and usually produces:
1. An estimate of the DPMO (defects per million opportunities).
2. One or more capability indices.
3. An estimate of the Sigma Quality Level at which the process operates.
STATGRAPHICS provides capability analyses for the following cases:
| Procedure | Statgraphics Centurion 18/19 | Statgraphics Sigma express |
Statgraphics stratus |
Statgraphics Web Services |
StatBeans |
|---|---|---|---|---|---|
| Capability Analysis for Measurement Data from a Normal Distribution |  |
 |
 |
 |
 |
| Capability Analysis for Measurement Data from Non-Normal Distributions |  |
 |
 |
 |
 |
| Capability Analysis for Correlated Measurements |  |
||||
| Capability Analysis for Counts or Proportions |  |
||||
| Capability Analysis for Rates |  |
||||
| Bayesian Estimation of Process Capability |  |
||||
| Sample Size Determination for Capability Indices |  |
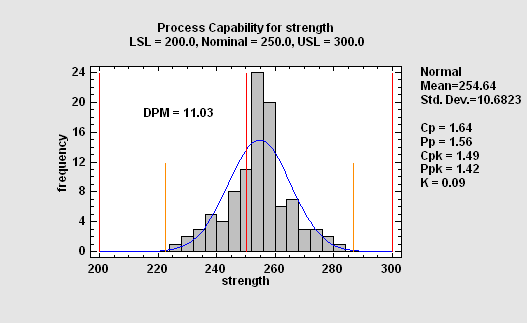
This procedure performs a capability analysis for data that are assumed to be a random sample from a normal distribution. It calculates capability indices such as Cpk, estimates the DPM (defects per million), and determines the sigma quality level (SQL) at which the process is operating. It can handle two-sided symmetric specification limits, two-sided asymmetric limits, and one-sided limits. Confidence limits for the most common capability indices may also be requested.
More: Capability Assessment SnapStat.pdf
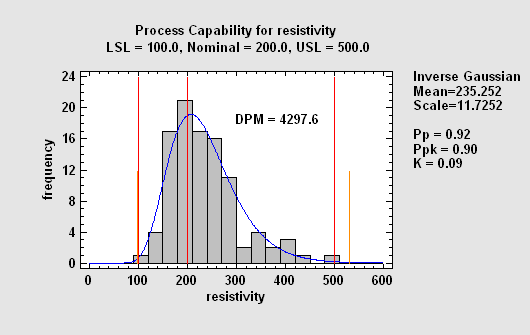
This procedure performs a capability analysis for data that are not assumed to come from a normal distribution. The program will fit up to 25 alternative distribution and list them according to their goodness-of-fit. For a selected distribution, it then calculates equivalent capability indices, DPM, and the SQL.
More: Capability Analysis (Variable Data).pdf or Watch Video
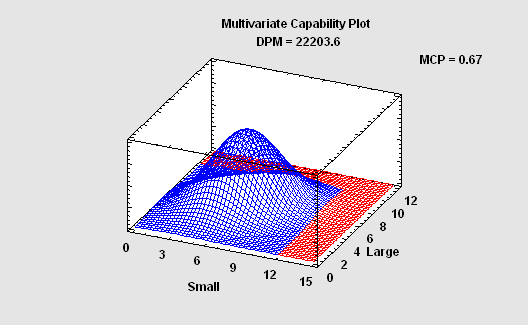
When the variables that characterize a process are correlated, separately estimating the capability of each may give a badly distorted picture of how well the process is performing. In such cases, it is necessary to estimate the joint probability that one or more variables will be out of spec. This requires fitting a multivariate probability distribution. This procedure calculates capability indices, DPM, and the SQL based on a multivariate normal distribution.
More:Multivariate Capability Anaysis.pdf or Watch Video
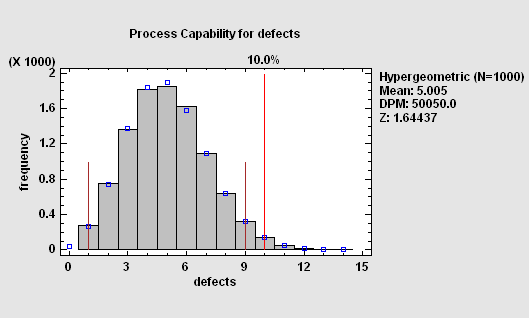
When examination of an item or event results in a PASS or FAIL rather than a measurement, the process capability analysis must be based on a discrete distribution. For very large lots, the relevant distribution is the binomial. For small lots or cases of limited opportunities for failure, the hypergeometric distribution must be used:
More: Capability Analysis (Percent Defective).pdf
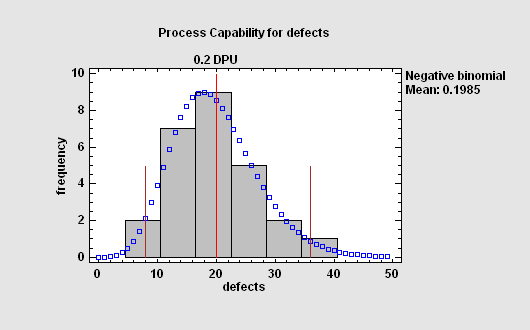
When the relevant measure of performance is a rate, then the process capability analysis is based on: a Poisson distribution if failures occur randomly; a negative binomial distribution if failures tend to occur in clumps.
More:Capability Analysis (Defects per Unit).pdf
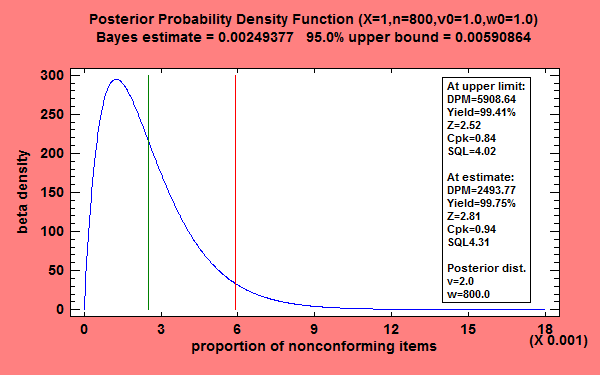
When prior knowledge exists about the probable proportion of nonconforming items generated by a process, a Bayesian approach to estimation of process capability can give more precise estimates than relying solely on a new data sample. Combining prior knowledge with current data creates a posterior distribution that may be used to create both point and interval estimates of process capability.
More: Attribute Capability Analysis Statlet.pdf or Watch Video
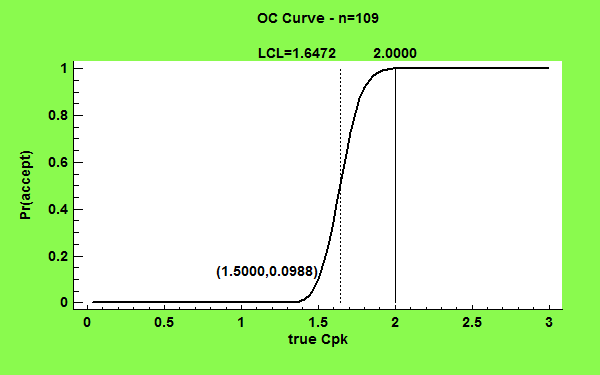
This procedure determines a suitable sample size for estimating three capability indices: Cp, Cpk, and Cpm. The determination is based on either the desired precision of the estimate or the power of a hypothesis test.
More: Sample Size Determination (Capability Indices).pdf or Watch Video

© 2025 Statgraphics Technologies, Inc.
The Plains, Virginia
CONTACT US
Have you purchased Statgraphics Centurion or Sigma Express and need to download your copy?
CLICK HERE