
Determining the reliability of manufactured items often requires performing a life test and analyzing observed times to failure. Such data is frequently censored, in that some items being tested may not have failed when the life data analysis test is ended. In addition, it may be necessary to accelerate failure times by changing the value of an influential variable such as temperature using failure analysis tools. For all of these reasons, special failure analysis tools are needed to deal with this type of data.
STATGRAPHICS provides several special procedures for using life data analysis software and dealing with failures times:
| Procedure | Statgraphics Centurion 18/19 | Statgraphics Sigma express |
Statgraphics stratus |
Statgraphics Web Services |
StatBeans |
|---|---|---|---|---|---|
| Life Tables |  |
||||
| Distribution Fitting with Censored Data | |
||||
| Weibull Analysis | |
|
|
||
| Accelerated Life Test Plots | |
||||
| Life Data Regression | |
||||
| Accelerated Life Testing |  |
||||
| Cox Proportional Hazards | |
||||
| Analysis of Repairable Systems | |
||||
| Reliability Demonstration Test Plans | |

More: Life Tables (Intervals).pdf, Life Tables (Times).pdf
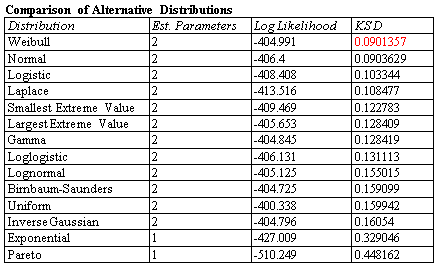
If sufficient data is available, it may be possible, using the right failure analysis tools, to fit a specific distribution to the failure times. Maximum likelihood methods can be easily adapted to the presence of censored data. STATGRAPHICS will automatically fit up to 45 probability distributions for any sample of data during life data analysis and rank them according to goodness-of-fit.
More: Distribution Fitting (Censored data).pdf
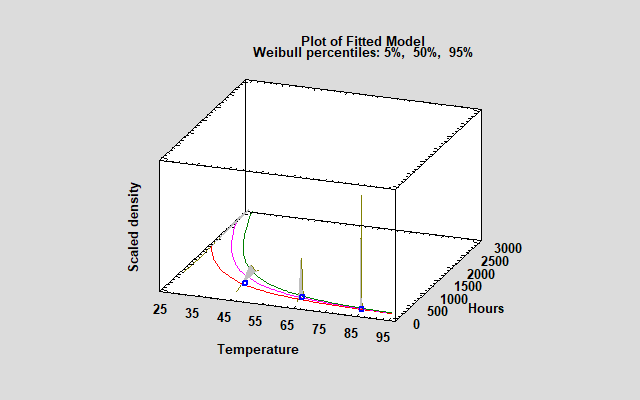
Experience has shown that data from life data analysis can often be well modeled by a Weibull distribution. A common method to check the fit of a Weibull distribution is through a Weibull plot. Uncensored failure times should fall approximately along a straight line. With STATGRAPHICS failure analysis tools, you may add a histogram of censored failure times and confidence limits for failure percentiles to the Weibull Plot.

More:Weibull Analysis.pdf
When failures do not occur often enough under normal operating conditions, it is necessary to accelerate the failures by increasing the stress caused by one or more variables. A very common accelerant is temperature. By analyzing failure rates at high temperatures and fitting an Arrhenius model, it is often possible to extrapolate the data back to a normal operating temperature (usually expressed in Kelvin).

Beginning with Version 19.6, Statgraphics has the ability to fit several different acceleration models to the mean or estimated percentile of a lifetime distribution fit at multiple values of an accelerating factor.
Model: Accelerated Life Test Plots.pdf
To describe the impact of external variables on failure times, regression models may be fit. Unfortunately, standard least squares techniques do not work well for two reasons: the data are often censored, and the failure time distribution is rarely Gaussian. For this reason, STATGRAPHICS provides a special procedure along with its failure analysis tools that will fit life data regression models with censoring, assuming either an exponential, extreme value, logistic, loglogistic, lognormal, normal or Weibull distribution.

More: Life Data Regression.pdf
Accelerated Life Testing
Version 19.6 of Statgraphics introduced a new procedure for accelerated life testing. The procedure fits various models to observed failure times collected under higher than normal levels of one or more stress variables. The fitted models are then extrapolated to estimate the failure time distribution under normal operating conditions.
The new procedure estimates 6 common acceleration models, including Arrhenius, Eyring and inverse power models. Failure times are assumed to follow one of 7 distributions, including the Weibull, lognormal and smallest extreme value distributions.
The data analyzed by the new procedure consists of observed failure times, which may be censored. The procedure supports any combination of right-censored, left-censored, or interval-censored data.
More: Accelerated Life Testing.pdf

More: Cox Proportional Hazards.pdf
This life data analysis procedure differs from the Distribution Fitting and Weibull Analysis procedures in that it allows for a failure rate that changes as the system ages.

More: Repairable Systems (Times).pdf, Repairable Systems (Intervals).pdf
Reliability Demonstration Test Plans
This procedure creates test plans to demonstrate that a failure time distribution satisfies stated conditions. For example, it may be desired to show with 95% confidence that the reliability of a product equals or exceeds 90% at the end of the warranty period. During the demonstration, n units will be tested for a duration equal to t. The demonstration will be considered successful if no more than f units fail during the test.


© 2025 Statgraphics Technologies, Inc.
The Plains, Virginia
CONTACT US
Have you purchased Statgraphics Centurion or Sigma Express and need to download your copy?
CLICK HERE


