Monte Carlo simulation is used to estimate the distribution of variables when it is impossible or impractical to determine that distribution theoretically. It is used in many areas, including engineering, finance, and DFSS (Design for Six Sigma). A typical Monte Carlo simulation includes: (1) One or more input variables X, some of which usually follow a probability distribution. (2) One or more output variables Y, whose distribution is desired. (3) A mathematical model coupling the X’s and the Y’s. Statgraphics also includes a wide array of random number generators for use in simulation models.
| Procedure | Statgraphics Centurion 18/19 | Statgraphics Sigma express |
Statgraphics stratus |
Statgraphics Web Services |
StatBeans |
|---|---|---|---|---|---|
| General Simulation Models |  |
 |
|||
| ARIMA Time Series Models |  |
||||
| Random Number Generation |  |
 |
 |
 |
 |
| Multivariate Normal Random Numbers |  |
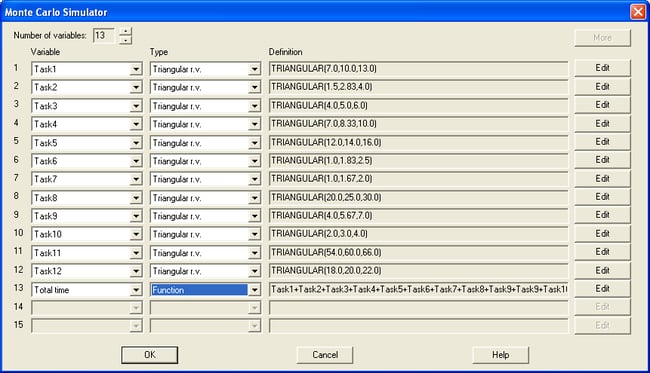
This procedure is used to find the distribution of one or more output variables defined by mathematical models coupling them with one of more input variables. A probability distribution for each input variable may be specified. The primary output includes estimated percentiles for the output variables.

More: Monte Carlo Simulation (General Simulation Models).pdf or Watch Video
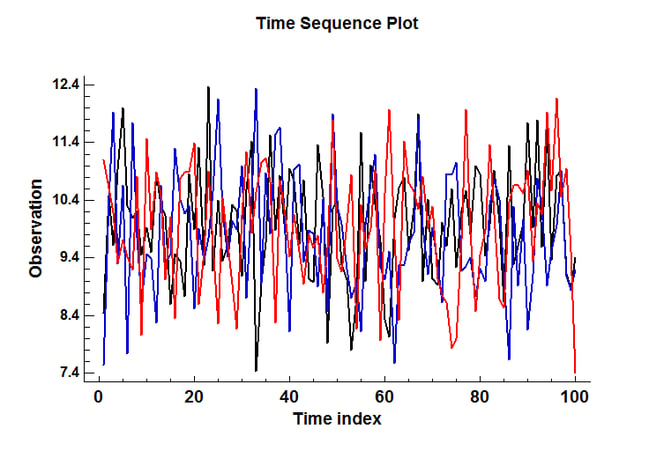
This procedure generates random samples from ARIMA time series models.

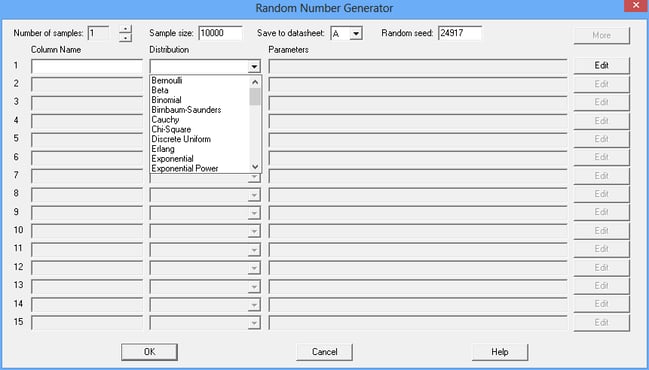
It is frequently necessary to generate random numbers from different probability distributions. This procedure simplifies the process of creating multiple samples of random numbers. 49 probability distributions are available.

More: Monte_Carlo_Simulation_Random_Number_Generation.pdf
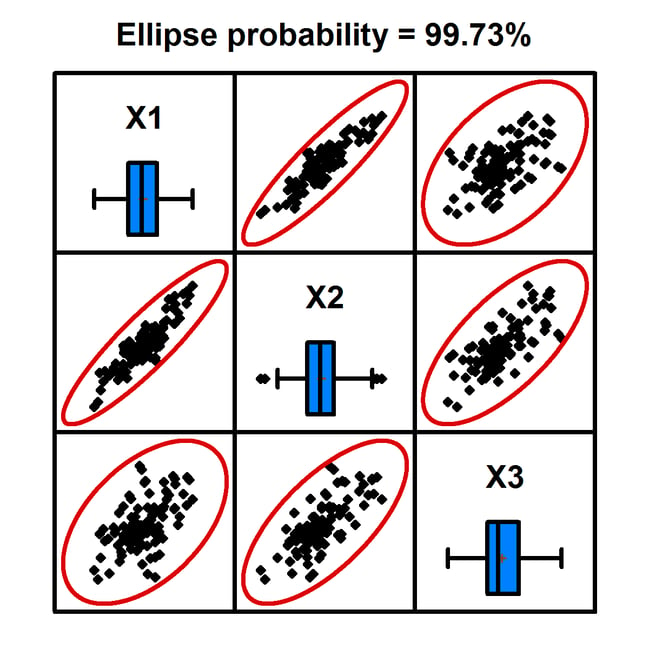
This procedure generates random numbers from a multivariate normal distribution involving up to 12 variables. The user inputs the variable means, standard deviations, and the correlation matrix. Random samples are generated which may be saved to the Statgraphics databook.


© 2025 Statgraphics Technologies, Inc.
The Plains, Virginia
CONTACT US
Have you purchased Statgraphics Centurion or Sigma Express and need to download your copy?
CLICK HERE