STATGRAPHICS contains extensive capabilities for the creation and analysis of statistically designed experiments. Statgraphics functions as design of experiments software that creates designs of several types:
| Type of Experimental Design | Statgraphics Centurion 18/19 | Statgraphics Sigma express |
Statgraphics stratus |
Statgraphics Web Services |
StatBeans |
|---|---|---|---|---|---|
| Screening Designs |  |
 |
|||
| Response Surface Designs |  |
 |
|||
| Mixture Experiments |  |
||||
| D-Optimal Designs |  |
||||
| Robust Parameter Designs |  |
||||
| Definitive Screening Designs |  |
||||
| Computer Generated Designs |  |
||||
| Single Factor Categorical Designs |  |
||||
| Multi-Factor Categorical Designs |  |
||||
| Variance Component Designs |  |
||||
| Design of Experiments Wizard |  |
||||
| Multiple Response Optimization |  |
||||
| Alias Optimal Designs (V19 only) |  |
||||
| Computer Augmented Designs (V19 only) |  |
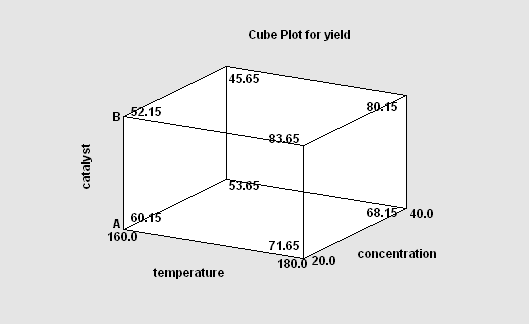
Screening designs are intended to determine the most important factors affecting a response. Most of the designs involve only 2 levels of each factor. The factors may be quantitative or categorical. Included are 2-level factorial designs, mixed level factorial designs, fractional factorials, irregular fractions, and Plackett-Burman designs. For designs of less than full resolution, the confounding pattern is displayed. Blocking and randomization are options.
More: DOE Wizard - Screening Designs.pdf
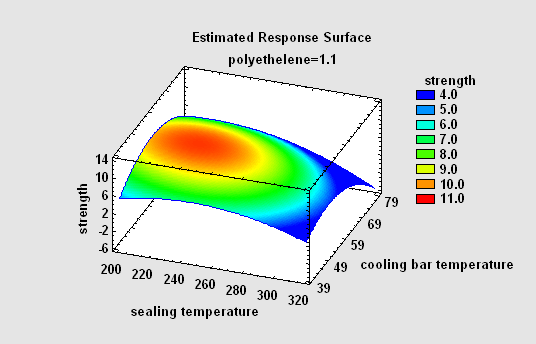
Response surface designs are intended to determine the optimal settings of the experimental factors. The designs involve at least 3 levels of the experimental factors. Included are central composite designs, Box-Behnken designs, 3-level factorials, and Draper-Lin designs.
More: DOE Wizard - Response Surface Designs.pdf
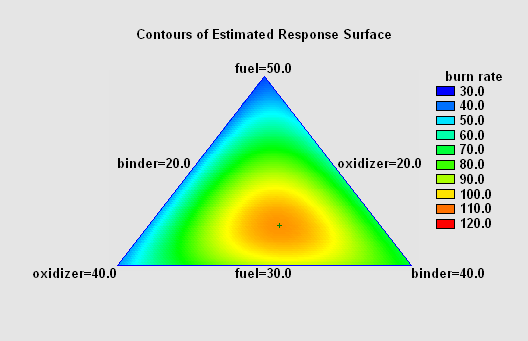
Mixture experiments involve components of a mixture, where the levels of the components are constrained to sum to 100% (or some other fixed value). Upper and lower constraints may be specified for each component. Included are simplex-lattice, simplex-centroid, and extreme vertices designs.
More: DOE Wizard - Mixture Experiments.pdf
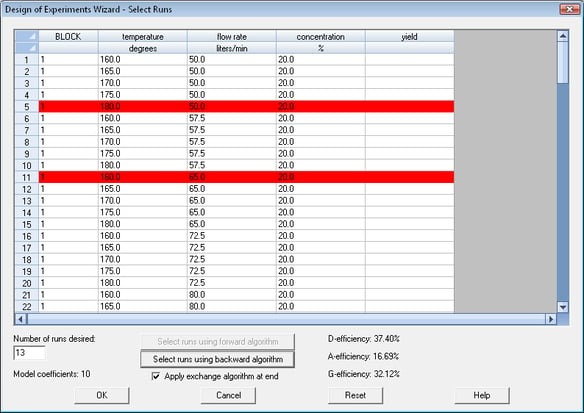
D-optimal designs are designs that seek to minimize the covariance matrix of the estimated coefficients in a specific statistical model. They are commonly used when the design region is constrained, or when additional runs need to be added to an undesigned experiment to improve its statistical properties.
Statgraphics users typically begin by creating a set of candidate runs using a multilevel factorial design. The DOE software program then selects an optimal subset of those runs by applying either a forward selection or backward selection plus an exchange algorithm. The result is a design with high D-efficiency, given the constraints.
More: DOE Wizard - Multilevel Factorial Designs.pdf
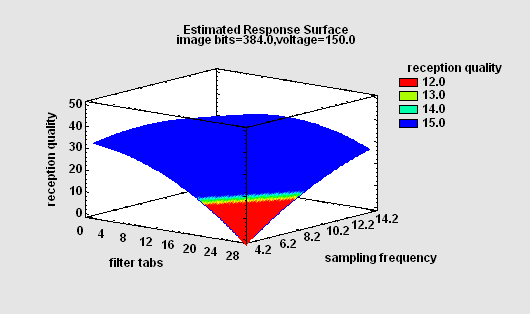
Statgraphics can create experimental designs for use in robust parameter design (RPD). In such experiments, two types of factors are varied: controllable factors that the experimenter can manipulate both during the experiment and during production, and noise factors that can be manipulated during the experiment but are normally uncontrollable. The goal of RPD is to find levels of the controllable factors where the response variables are relatively insensitive to changes in the noise factors.
RPD designs may be created using either the crossed approach of Taguchi (with inner and outer arrays) or the combined approach of Montgomery (both types of factors varied in a single array).
More: DOE Wizard - Robust Parameter Designs.pdf
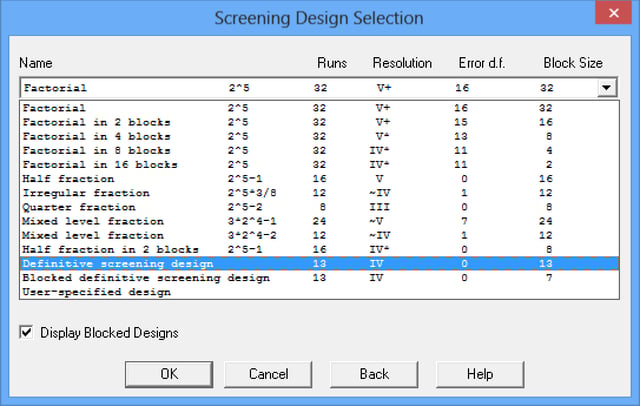
Definitive screening designs are small designs capable of estimating models involving both linear and quadratic effects, although second-order interactions are partially confounded with themselves and with quadratic effects. In addition, designs for 6 or more factors collapse into designs which can estimate the full second-order model (including interactions) for any 3 factors.
More: DOE Wizard - Definitive Screening Designs.pdf or Watch Video
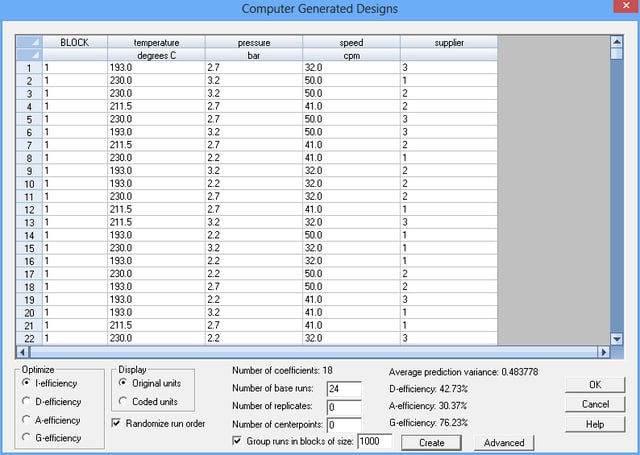
The Computer Generated designs allow you to create experimental designs which have optimal properties with respect to the estimation of specific statistical models. Given the definition of an experimental region, a model to be estimated, and the number of experimental runs that can be performed, the program searches for a set of runs that maximizes a selected design optimality criteria.
More: DOE Wizard - Computer Generated Designs.pdf
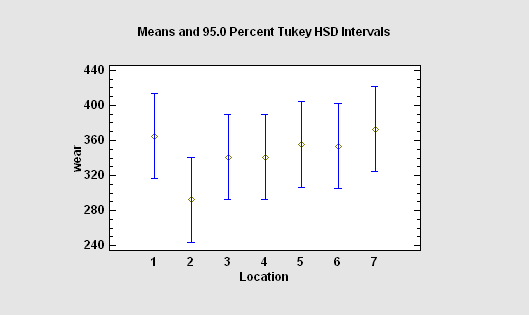
Single Factor Categorical designs are used to compare levels of a single non-quantitative factor. They include completely randomized designs, randomized block designs, balanced incomplete block (BIB) designs, Latin Squares, Graeco-Latin Squares, and hyper-Graeco-Latin Squares.
More: DOE - Single Factor Categorical Designs.pdf
Multi-Factor Categorical designs are used to study multiple non-quantitative factors, with several levels of each. They are analyzed using a multifactor analysis of variance.
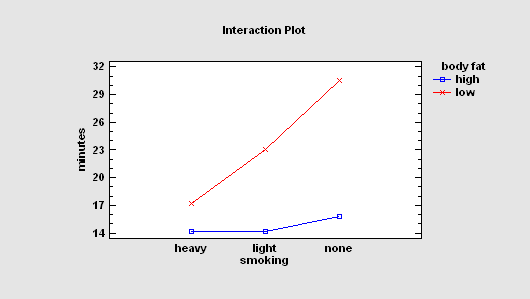
More: DOE - Multi-Factor Categorical Designs.pdf
Variance Component (hierarchical) designs are used to study the effect of two or more nested factors on the variability of a response. Estimates of the contribution of each factor to the overall variability are obtained.
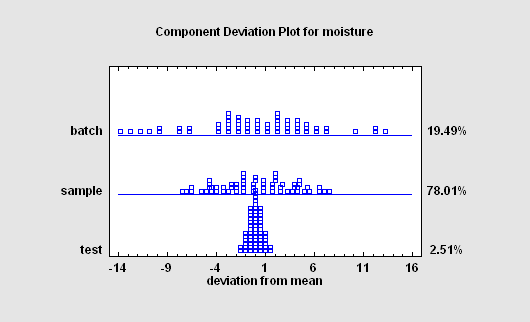
More: DOE - Variance Component Designs.pdf
STATGRAPHICS Centurion contains a wizard that assists users in constructing and analyzing designed experiments. It guides the user through twelve important steps. The first 7 steps are executed before the experiment is run. The final 5 steps are executed after the experiment has been performed.
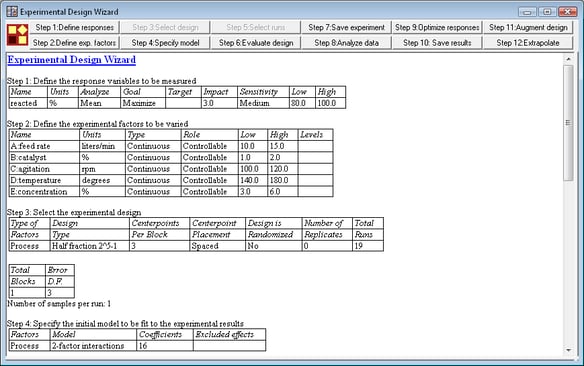
More: Design of Experiments Wizard.pdf
In order to find a combination of the experimental factors that provides a good result for multiple response variables, the DOE Wizard uses the concept of desirability functions. Desirability functions provide a way to balance the competing requirements of multiple responses, which may be measured in different units. Users specify the target value or acceptable range for each response, together with its relative importance. The program then finds the best combination of the experimental factors.
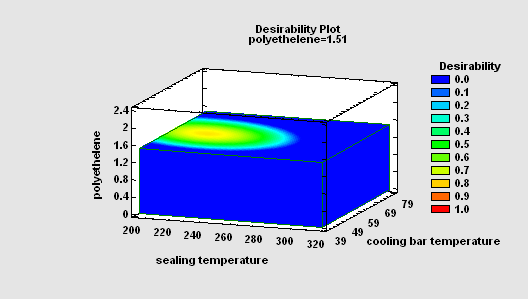
More: Design of Experiments Wizard.pdf
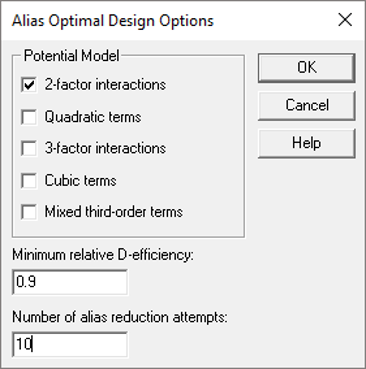
The Alias-Optimal designs generated by the DOE Wizard consider not only the precision in the estimated model coefficients but also potential bias in those estimates caused by active effects that are not in the assumed model. Criteria such as D-optimality do not take into account aliasing caused by omitted effects. Sometimes, alternative D-optimal designs may be subject to considerably different amounts of aliasing. At other times, a small reduction in the efficiency of the selected design may result in a large reduction in potential bias.
More: DOE Wizard: Alias Optimal Designs.pdf or Watch Video
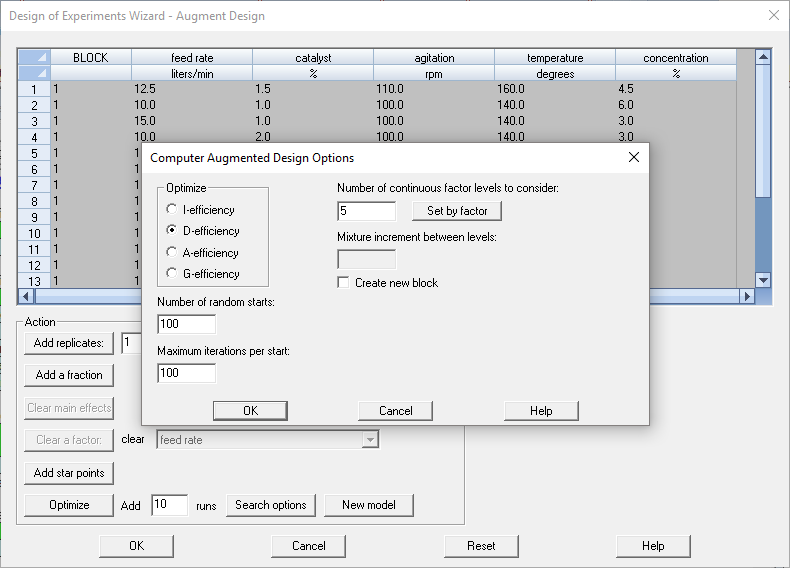
The DOE Wizard can now augment existing designs to maximize design efficiency. Users select the number of additional runs to add to the design, the model to be fit, and the optimality criterion to be maximized.

© 2025 Statgraphics Technologies, Inc.
The Plains, Virginia
CONTACT US
Have you purchased Statgraphics Centurion or Sigma Express and need to download your copy?
CLICK HERE