
Non-parametric methods are used to analyze data when the distributional assumptions of more common procedures are not satisfied. For example, many statistical procedures assume that the underlying error distribution is Gaussian, hence the widespread use of means and standard deviations. When the error distribution is not known, non-parametric statistical tests may be safer to apply.
The non-parametric methods in Statgraphics are options within the same procedures that apply the classical tests. These non-parametric statistical methods are classified below according to their application.

| Application | Statgraphics Centurion 18/19 | Statgraphics Sigma express |
Statgraphics stratus |
Statgraphics Web Services |
StatBeans |
|---|---|---|---|---|---|
| Goodness-of-Fit Tests |  |
|
|
|
|
| Inferences in One Sample or Paired Samples | |
|
|
|
|
| Comparing Two Samples | |
|
|
|
|
| Comparing Multiple Samples | |
|
|
|
|
| Correlation Analysis | |
|
|
|
|
| Tests for Association | |
|
|
|
|
| Tests for Randomness | |
|
|
|
|
| Density Estimation | |
|
|
|
|
| Curve Fitting | |
|
|
|
|
| Nonparametric Tolerance Limits | |
||||
| Neural Networks | |
||||
| Median Polish | |
||||
| Kriging | |
Goodness-of-fit tests are used to compare the frequency of occurrence of observations (either quantitative or categorical) to a probabilistic model. Specific tests include the chi-square goodness-of-fit test, the Kolmogorov-Smirnov test, and the Anderson-Darling test.

More: Frequency Tables.pdf, Contingency Tables.pdf, Distribution Fitting (Uncensored Data).pdf

More:One Variable Analysis.pdf
When data are collected from two populations by taking independent samples, test statistics can be created without assuming that observations from the populations are normally distributed. The Two Sample Comparison procedure performs a Mann-Whitney (Wilcoxon) test to compare the medians and a two-sided Kolmogorov-Smirnov test to compare the entire distributions.

More:Two Sample Comparison.pdf
When data are collected from more than two populations, the Multiple Sample Analysis procedure can test for significant differences between the population medians using either a Kruskal-Wallis test, Mood's median test, or the Friedman test. It can also create notched box-and-whisker plots, which have the property that any 2 samples with median notches that do not overlap demonstrate a statistically significant difference between their respective population medians.

The Multiple Variable Analysis procedure will calculate correlations between pairs of variables using the Pearson product-moment correlation coefficients, or rank correlations using either Kendall's or Spearman's method. The table at the right shows estimated correlations, sample size and approximate P-values for 4 demographic variables.
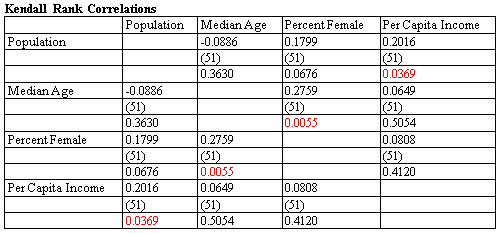
More:Multiple Variable Analysis.pdf
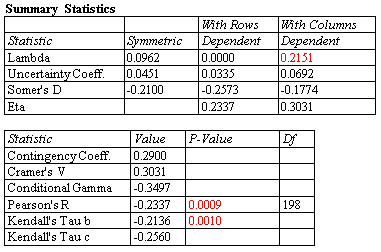
For categorical data, various measures of association between the levels of two factors may be calculated in the Contingency Tables procedure. The table at the left shows statistics for a typical 2-by-2 table.
For sequential data, run tests may be performed to determine whether or not the data come from a random process. The Run Charts procedure performs tests by counting the number of runs above and below the median, and by counting the number of runs up and down.

More:Run Chart.pdf
Several procedures in Statgraphics calculate a density trace. Given a single column of continuous numeric data, the density trace provides a nonparametric estimate of the probability density function of the population from which the data were sampled. It is created by counting the number of observations that fall within a window of fixed width moved across the range of the data.

More: Distribution Fitting (Uncensored Data).pdf
The Simple Regression procedure provides 2 alternatives to least squares for fitting linear and nonlinear curves relating Y and X. These include minimizing the sum of the absolute deviations around the fitted curve and Tukey's method of using the medians of 3 groups.

More: Simple Regression.pdf
Statistical tolerance limits give a range of values for X such that one may be 100(1-a)% confident that P percent of the population from which a data sample comes falls within that range. Nonparametric limits do not assume that the data come from any particular distribution. However, they are not as precise or as flexible as those based on the assumption of a specific distribution.

More: Statistical Tolerance Limits (Observations).pdf
The Probabilistic Neural Network Classifier (PNN) implements a nonparametric method for classifying observations into one of g groups based on p observed quantitative variables. Rather than making any assumption about the nature of the distribution of the variables within each group, it constructs a nonparametric estimate of each group’s density function at a desired location based on neighboring observations from that group. The estimate is constructed using a Parzen window that weights observations from each group according to their distance from the specified location.

More: Neural Network Classifier.pdf
The Median Polish procedure constructs a model for data contained in a two-way table. The model represents the contents of each cell in terms of a common value, a row effect, a column effect, and a residual. Although the model used is similar to that estimated using a two-way analysis of variance, the terms in the model are estimated using medians rather than means. This makes the estimates more resistant to the possible presence of outliers.
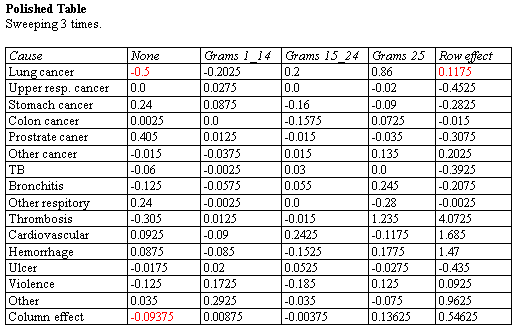
More: Median Polish.pdf
Kriging is a procedure that is widely used to analyze geospatial data. Given a set of measurements taken on a variable at various locations within a two-dimensional region, estimates are derived for the value of that variable throughout the region. The primary output is a map of the estimated value, together with the variance of the estimate.

More: Kriging.pdf, Kriging Statlet.pdf

© 2025 Statgraphics Technologies, Inc.
The Plains, Virginia
CONTACT US
Have you purchased Statgraphics Centurion or Sigma Express and need to download your copy?
CLICK HERE


