
Statpoint Technologies products provide a wide range of procedures for accomplishing basic statistical tasks.This section describes some procedures in our basic statistics software for handling data sampled from one or more populations:

| Procedure | Statgraphics Centurion 18/19 | Statgraphics Sigma express |
Statgraphics stratus |
Statgraphics Web Services |
StatBeans |
|---|---|---|---|---|---|
| One Sample Analysis |  |
|
|
|
|
| Outlier Identification | |
|
|
|
|
| Comparing Two Independent Samples | |
|
|
|
|
| Comparing Two Paired Samples | |
|
|
|
|
| Comparing Multiple Samples | |
|
|
|
|
| Comparing Rates and Proportions | |
|
|
||
| Equivalence and Noninferiority Tests for Means | |
||||
|
Equivalence and Noninferiority Tests for Variances (V19 only) |
|
||||
| Power Transformations | |
|
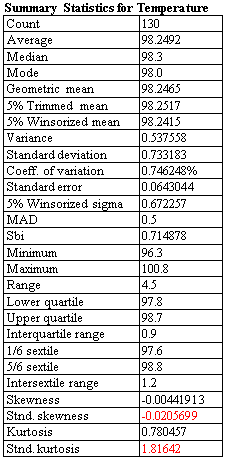
The One Variable Analysis procedure is one of the primary procedures for analyzing a single column of numeric data. It calculates summary statistics and confidence intervals, performs hypothesis tests, and creates a variety of graphical displays. The graphs include a scatterplot, histogram, box-and-whisker plot, quantile plot, normal probability plot, density trace, and symmetry plot. The tables include percentiles and a stem-and-leaf display.

More: One Variable Analysis.pdf
The Outlier Identification procedure is designed to help determine whether or not a sample of n numeric observations contains outliers. Outliers are observations that do not come from the same distribution as the rest of the sample. Both graphical methods and formal statistical tests due to Grubbs and Dixon are included. The procedure will also save a column of flags identifying the outliers in a form that can be used to exclude those observations when running other procedures.

More: Outlier Identification.pdf
The Two Sample Comparison procedure is designed to compare two independent samples of variable data. Tests are run to determine whether or not there are significant differences between the means, variances, and/or medians of the populations from which the samples were taken. In addition, the data may be displayed graphically in various ways, including a dual histogram, a multiple box-and-whisker plot, and a quantile-quantile plot.

More: Two Sample Comparison.pdf
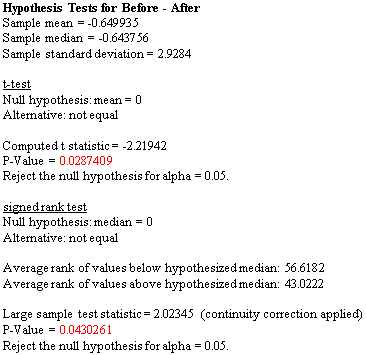
The Paired Sample Comparison procedure is designed to compare data in 2 numeric columns where the values in each row are paired, i.e., correspond to the same subject or experimental unit. The primary reason for such a comparison is typically to determine whether or not the factor that differentiates the columns has a significant effect on the data.
More: Paired Sample Comparison.pdf

More: Multiple Sample Comparison.pdf
Procedures are also available for comparing the observed rates of an event amongst k samples (based on a Poisson distribution), or comparing the observed proportions (based on a binomial distribution). Tests provided include a dispersion test, a chi-square test, and a likelihood ratio test. The procedures also perform an analysis of means (ANOM) to determine which samples differ significantly from the overall average.

More: Comparison of Rates.pdf, Comparison of Proportions.pdf
Four procedures are available to demonstrate equivalence (two-sided) or noninferiority (one-sided) of means. They are used to compare 2 independent means, compare 2 paired means, compare a single mean against a target value, and analyze the results of a 2x2 crossover study. Unlike standard hypothesis tests which are designed to prove superiority of one method over another, equivalence tests are designed to prove that two methods have essentially the same mean.

More: Equivalence & Noninferiority Tests (Comparing Mean to Target).pdf, Equivalence & Noninferiority Tests (Comparing Two Means).pdf, Equivalence & Noninferiority Tests (Comparing Paired Samples).pdf, Equivalence & Noninferiority Tests (2x2 Crossover Study).pdf or Watch Videos Part 1: 2 Independent Samples, Part 2: 2x2 Crossover Studies
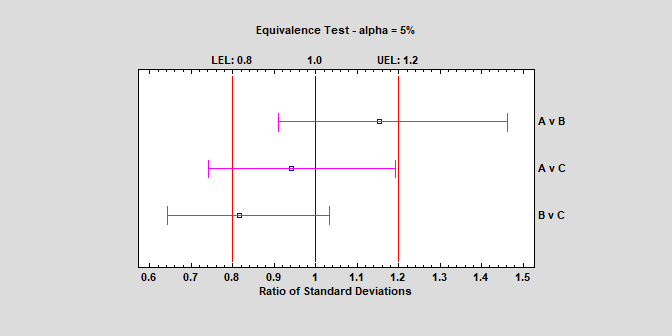
Two procedures are available to demonstrate equivalence (two-sided) or noninferiority (one-sided) of variances. They are used to compare 2 independent variances and to compare a single variance to a target value. Unlike standard hypothesis tests which are designed to prove superiority of one method over another, equivalence tests are designed to prove that two methods have essentially the same variance. Watch Video
More: Equivalence & Noninferiority Tests (Comparing Variance to Target).pdf, Equivalence & Noninferiority Tests (Comparing Two Variances).pdf
The Power Transformations procedure is designed to determine a normalizing transformation for a column of numeric observations that do not come from a normal distribution. In such cases, it is often possible to find a power transformation that will make the data approximately normal. Given such a transformation, statistical procedures that assume normality can then be applied to the transformed data.

More: Power Transformations.pdf, Power Transformations Statlet.pdf

© 2025 Statgraphics Technologies, Inc.
The Plains, Virginia
CONTACT US
Have you purchased Statgraphics Centurion or Sigma Express and need to download your copy?
CLICK HERE


