
Data Mining refers to a process by which patterns are extracted from data. Such patterns often provide insights into relationships that can be used to improve business decision making. Statistical data mining tools and techniques can be roughly grouped according to their use for clustering, classification, association, and prediction.

| Procedure | Statgraphics Centurion 18/19 | Statgraphics Sigma express |
Statgraphics stratus |
Statgraphics Web Services |
StatBeans |
|---|---|---|---|---|---|
| Clustering |  |
||||
| Classification | |
||||
| Association | |
|
|
|
|
| Prediction | |
||||
| Classification and Regression Trees | |
||||
| Text Mining | |
||||
| Decision Forests (V19 only) | |
||||
| K-Means Clustering (V19 only) | |
Clustering refers to data mining tools and techniques by which a set of cases are placed into natural groupings based upon their measured characteristics. Since the number of characteristics is often large, a multivariate measure of similarity between cases needs to be employed. When looking for how to data mine, Statgraphics provides a number of methods for deriving clusters, including nearest neighbor, furthest neighbor, centroid, median, group average, Ward's method, and the method of K-Means. The results may be displayed as a dendrogram, a membership table, or an icicle plot. Agglomeration plots are used to suggest the proper number of clusters.

More: Cluster Analysis.pdf
Classification is among the data mining tools and techniques by which a set of cases are assigned to levels of a categorical factor based upon their characteristics. A training set of known cases is used to develop a classification algorithm which can then be used to predict which category unknown cases are most likely to belong to. For example, applicants for a loan might be placed into risk categories based upon their personal characteristics, given an algorithm developed from previous applicants.
The Neural Network Classifier in Statgraphics uses a method based on nonparametric density function estimates combined with Bayesian priors.

More: Neural Network Classifier.pdf

Measures of Association are used to identify variables that are related to each other. If the factors are quantitative, correlation coefficients may be used for statistical data mining tools and techniques like this. If the factors are non-quantitative, other measures of association are used for considering how to data mine. A matrix plot with nonlinear Lowess smoothers is shown below.
Statgraphics includes statistics such as Pearson's product-moment correlation coefficient, Kenkall and Spearman rank correlations, partial correlations, lambda, the uncertainty coefficient, Somer's D, the contingency coefficient, eta, Cramer's V, conditional gamma, Pearson's R, and Kendall's tau.

More: Multiple Variable Analysis.pdf,Contingency Tables.pdf
Prediction refers to the development of statistical models that can predict the value of one variable given the values of other variables. Regression models of various sorts are often used among data mining tools and techniques. When the number of predictors is large, selection of a good model can be difficult. In Statgraphics, the Regression Model Selection procedure of statistical data mining fits models involving all possible linear combinations of a set of predictors all selects the best models using criteria such as Mallows' Cp and the adjusted R-squared statistic.

More: Regression Model Selection.pdf
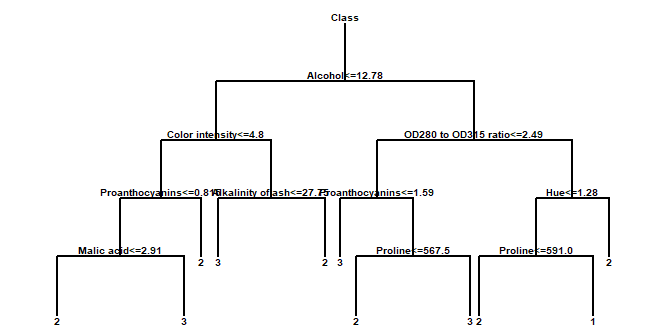
The Classification and Regression Trees procedure implements a machine-learning process to predict observations from data. It creates models of 2 forms:
The models are constructed by creating a tree, each node of which corresponds to a binary decision. Given a particular observation, one travels down the branches of the tree until a terminating leaf is found. Each leaf of the tree is associated with a predicted class or value.

More: Classification and Regression Trees.pdf or Watch classification trees video or Watch regression trees video
The Text Mining procedure analyzes one or more text columns or documents to determine how frequently various words are used. The main output of this procedure is an identification of those words that occur most frequently. Both tabular and graphical summaries are provided.

More: Text Mining.pdf or Watch Video
The Decision Forests procedure implements a machine-learning process to predict observations from data. It creates models of 2 forms:
The models are constructed by creating a large number of decision trees and averaging the predictions made from those trees. Many trees are constructed using a procedure similar to that of Classification and Regression Trees, with randomized node optimization and “bagging”.
More: Decision Forests.pdf or Watch Video
The K-Means Clustering procedure implements a machine-learning process to create groups or clusters of multivariate quantitative variables. Clusters are created by grouping observations which are close together in the space of the input variables. Unlike in the Cluster Analysis procedure listed above, the user does not have to specify initial seeds for each cluster.
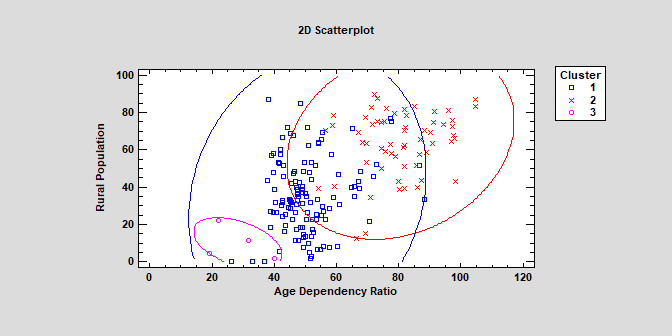
More: K-Means Clustering.pdf or Watch Video


© 2025 Statgraphics Technologies, Inc.
The Plains, Virginia
CONTACT US
Have you purchased Statgraphics Centurion or Sigma Express and need to download your copy?
CLICK HERE


